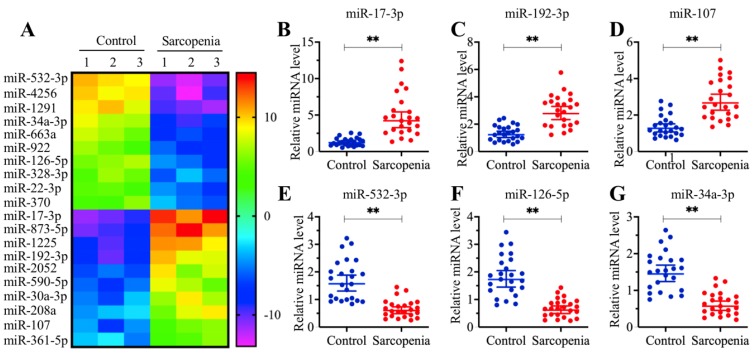
Figure 2.
The expression of miR-532-3p was significantly decreased in sarcopenia patients. (A) The heat map of 20 miRNAs that were differentially expressed in sarcopenia patient samples. Three-paired muscle tissues from healthy controls and sarcopenia patients were subjected to RNA isolation and subsequent microarray assays. The top 20 miRNAs that were aberrantly expressed were shown. (B-G) Verification of three upregulated and three downregulated miRNA levels by qRT-PCR. Twenty-four-paired muscle tissues from healthy controls and sarcopenia patients were used for qRT-PCR analyses to measure the relative expression levels of miR-17-3p (B), miR-192-3p (C), miR-107 (D), miR-532-3p (E), miR-126-5p (F), and miR-34a-3p (G). The expression of individual miRNAs in one healthy control sample was defined as one-fold. ** P < 0.01.

