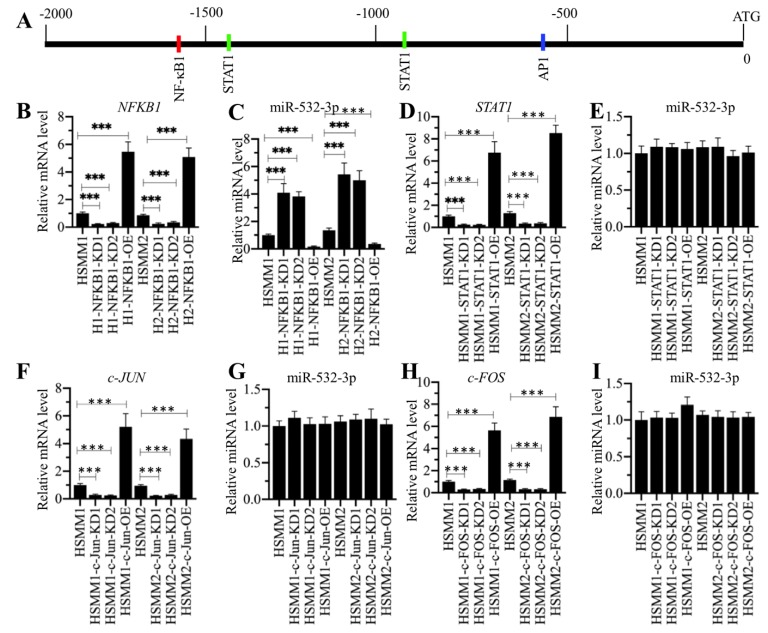
Figure 6.
NFKB1/p50 specifically repressed the expression of miR-532-3p. (A) The transcription factor binding sites in the promoter of miR-532-3p. A 2000 bp-length promoter fragment was used to predict the transcription factor binding sites. The binding positions of NFKB1 (p50), STAT1 and AP-1 were indicated. (B-I) The effects of overexpressing or downregulating different transcription factors on miR-532-3p level. HSMM-1 and HSMM-2 cells were transfected with individual transcription factor-specific siRNAs and the corresponding overexpression vectors to generate the knockdown (KD) and overexpression (OE) cells. The resulting cells were subjected to RNA isolation, followed by the measurement of miR-532-3p level using qRT-PCR analyses. (B and C) The expression levels of NFKB1 (B) and miR-532-3p (C) in NFKB1-KD and NFKB1-OE cells. *** P < 0.001. (D and E) The expression levels of STAT1 (D) and miR-532-3p (E) in STAT1-KD and STAT1-OE cells. *** P < 0.001. (F and G) The expression levels of c-JUN (F) and miR-532-3p (G) in c-JUN-KD and c-JUN-OE cells. *** P < 0.001. (H and I) The expression levels of c-FOS (H) and miR-532-3p (I) in c-FOS-KD and c-FOS-OE cells. *** P < 0.001.

