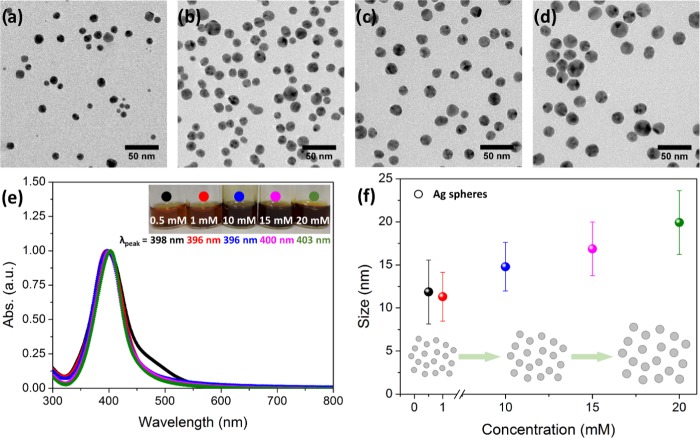
Figure 3.
Effect of the reaction concentration (at 10 min and 120 °C). (a–d) Representative TEM images of the different reaction concentrations analyzed (1, 10, 15, and 20 mM, respectively). (e) UV–vis measurements of the same samples. The inset contains digital images of the samples. (f) Mean size evolution with concentration (the error bars represent the standard deviation over the population mean). Inset: scheme of the Ag NP evolution with the reaction concentration.

