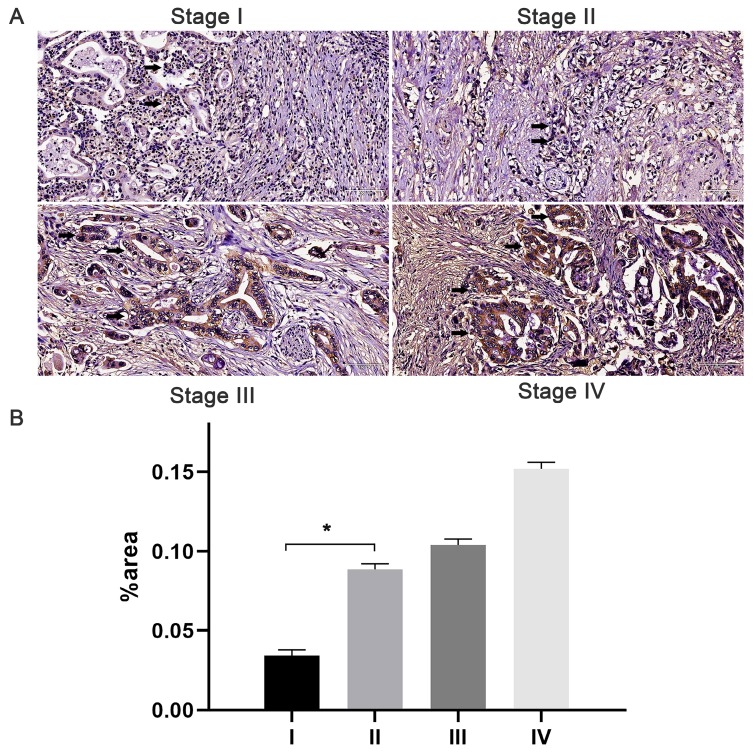
Figure 1.
Expression of JAM-B in pancreatic cancer (PanCa) tissues and its association with patient progression. (A) Expression of JAM-B in stage I, II, III and IV PanCa. Arrowheads show the cells of interest. (B) Relative protein levels of JAM-B are shown as bar diagrams (*P<0.05, compared with stage I).

