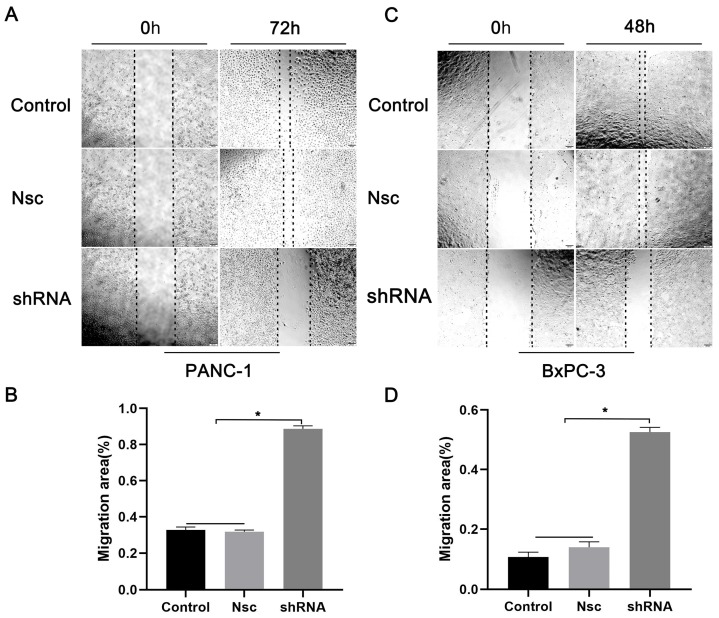
Figure 3.
Effects of silencing JAM-B on cell migration in PanCa cell lines. (A) Cell scratch wound assay was carried out to detect the effects of the silencing of JAM-B on the migration of PANC-1at 0h and 72h. (B) Relative migration levels of PANC-1 are shown as bar diagrams (*P<0.05, compared with control and Nsc). (C) Cell scratch wound assay was carried out to detect the effects of the silencing of JAM-B on the migration of BxPC-3 at 0h and 48h. (D) Relative migration levels of BxPC-3 are shown as bar diagrams (*P<0.05, compared with control and Nsc).

