Figure 6.
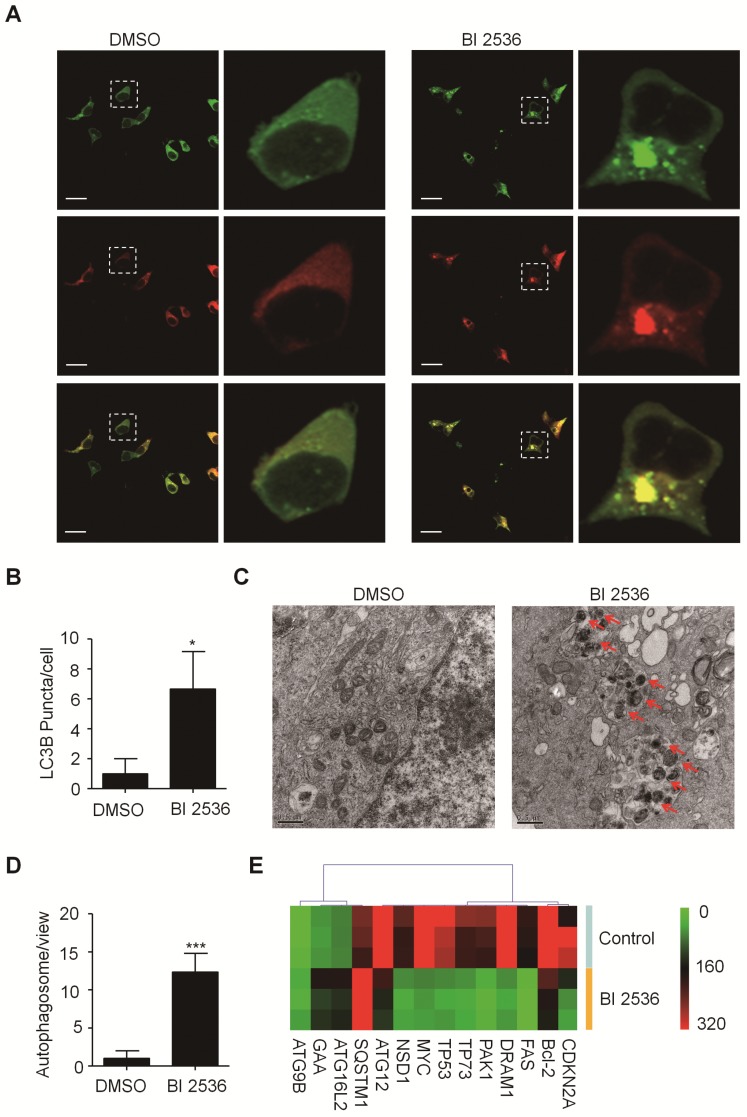
BI 2536 attenuated autophagy in neuroblastoma cells. (A) Immunofluorescence confocal images showing the increased formation of LC3-II puncta induced by BI 2536 treatment in SH-SY5Y cells. (B) Number of LC3-II puncta per cell in SH-SY5Y cells treated by DMSO or BI 2536. (C) Transmission electron microscopy images showing the increased formation of autophagosome induced by BI 2536 treatment in SH-SY5Y cells. The red arrows point out the autophagosome induced by BI 2536. Scale bar represents 0.5 μm. (D) Number of autophagosomes in every view in SH-SY5Y cells treated by DMSO or BI 2536. (E) Differentially Expressed autophagy-related genes in SH-SY5Y cells upon 10nM BI 2536 treatment. *P<0.05 and ***P < 0.001. P values were determined by two-tailed t tests. All data are representative of three independent experiments with n = 3-6 per group and are means ± s.e.m.

