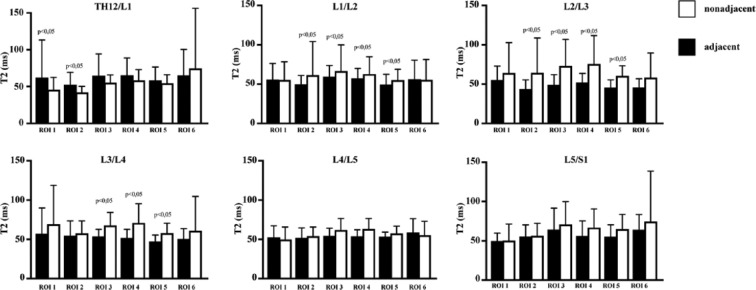
Figure 3.
Average T2 relaxation time values for the segments Th12/L1 to L5/S1. For each region of interest (ROI), black bars display data of adjacent intervertebral discs, white bars display data of nonadjacent intervertebral discs. Statistically significant differences between adjacent and nonadjacent intervertebral discs are marked with P ≤ 0.05.

