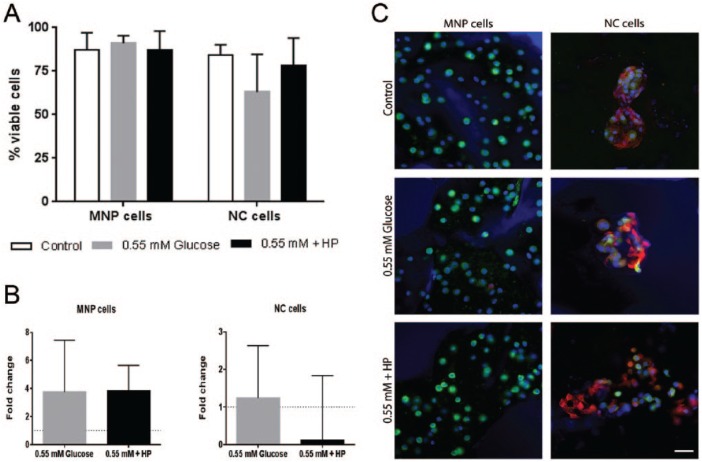
Figure 5.
(A) Viability of mature nucleus pulposus (MNP) and notochordal (NC) cells following 24-hour culture under control (5.5 mM glucose), 0.55 mM glucose and 0.55M glucose + HP (high pressure) loading. (B) T (brachyury) gene expression relative to paired atmospheric control (y = 1) (mean ± SD, N = 3). (C) MNP and NC cells labeled against vimentin (green) and cytokeratin 8 (red) counterstained with Hoechst (blue), scale bar = 20 µm (For interpretation of the references to colours in this figure legend, refer to the online version of this article).

