Figure 3.
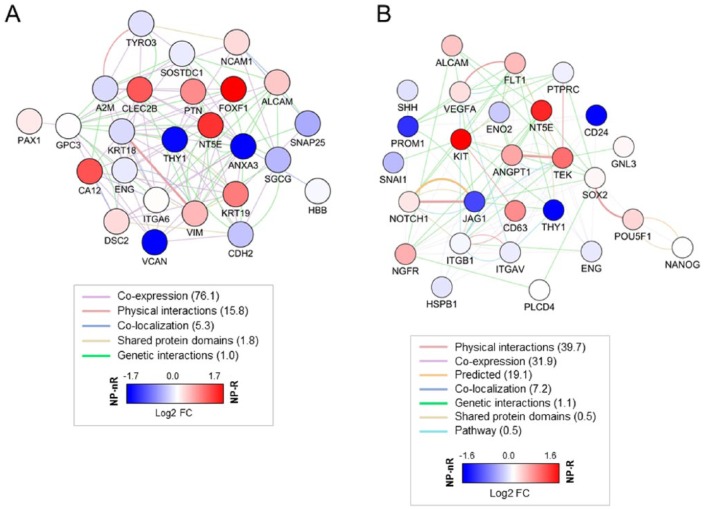
Differential expression of published NP markers among NP cellular subtypes. (A) Selected marker genes (NP cell markers; Suppl. Tables S1 and S2) were used as input for GeneMANIA network building using Cytoscape visualization software. Gene expression differences between NP-R (red) and NP-nR (blue) clones are depicted as log2-based fold change (FC) in colored circles. Colored lines in the network represent established biological connections between markers; parentheses: percentage representation. The network is strongly interconnected based on co-expression and genetic interactions studies. Of note: established NP markers are not equally expressed by isolated cellular subpopulations derived from the NP. (B) Progenitor-associated gene expression in NP-Responder clones. Selected genes (NP progenitor markers; Table 1 , Suppl. Table S2) were used as input for network building using GeneMANIA and Cytoscape visualization software. Gene expression differences between NP-R (red) and NP-nR (blue) clones are depicted as log2-based FC in colored circles. Colored lines in the network represent established biological connections between markers; parentheses: percentage representation (For interpretation of the references to colours in this figure legend, refer to the online version of this article).

