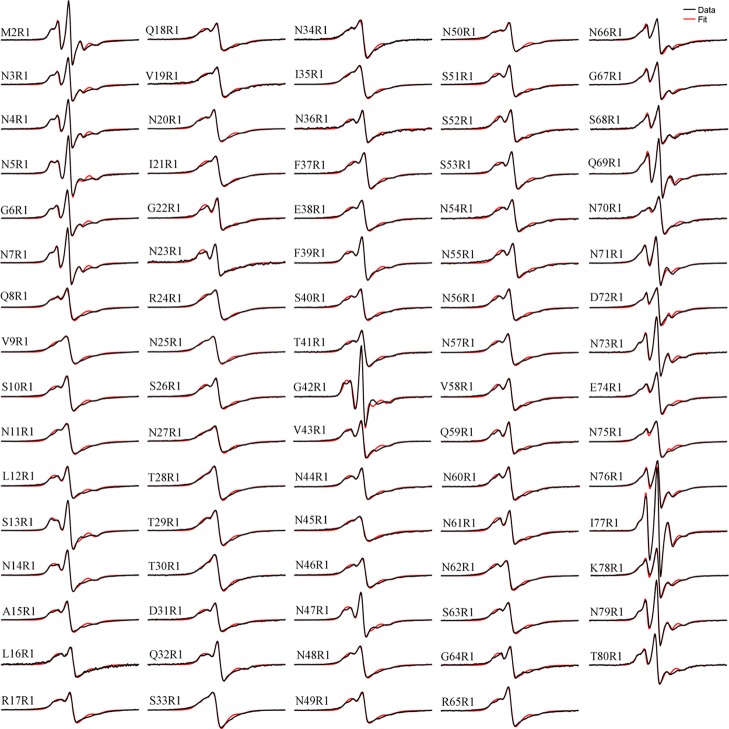
Figure 2.
EPR spectra of Ure2 amyloid fibrils with spin labels at residues 2–80. The experimental spectra (black traces) are superimposed on the best fit of the simulated spectra (red traces). EPR spectral simulation and fitting was used to extract the strength of the spin–exchange interaction. All spectra are normalized to the same number of spins. The scan width is 200 G.

