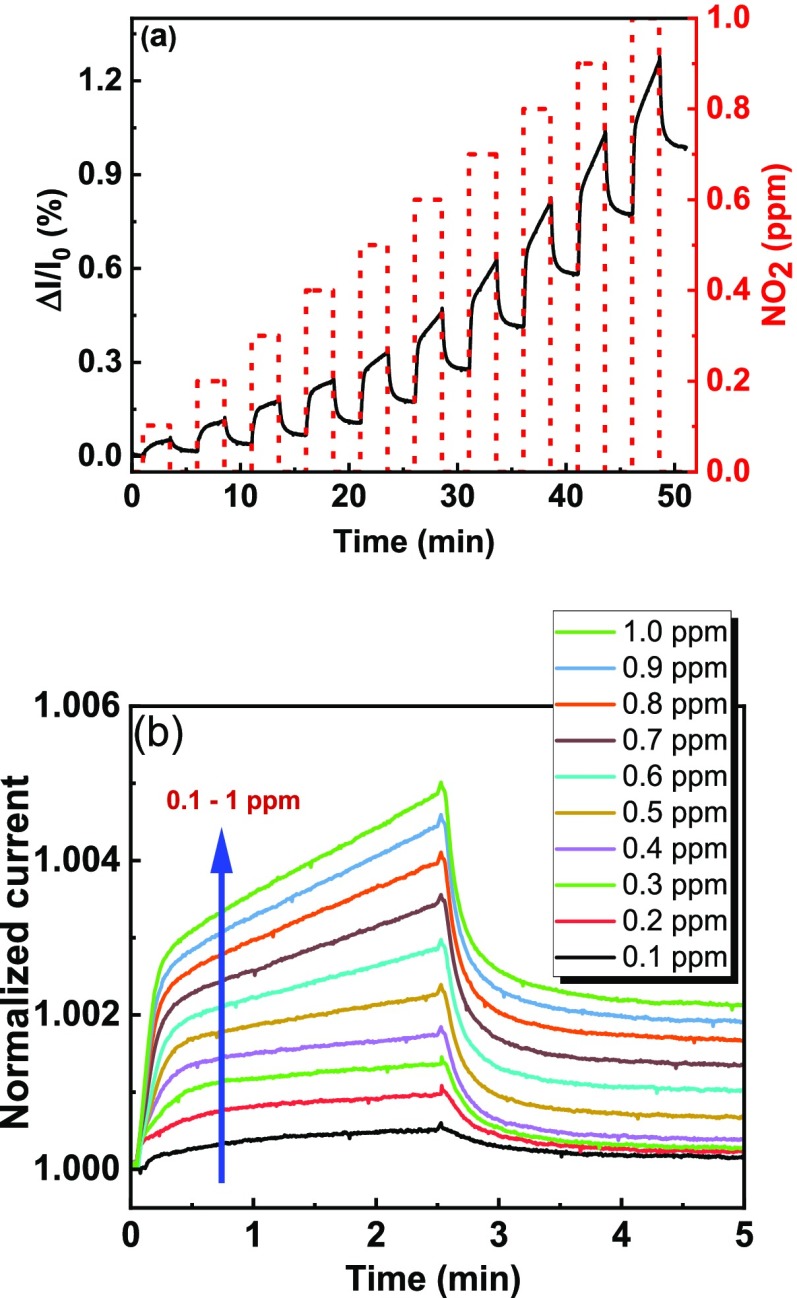
Figure 2.
(a) Real-time current behavior (black curve) of PtSe2-CR #1 during exposure to increasing concentrations of NO2 (red dashed rectangles). Dry N2 is used as a buffer gas. (b) Signals recorded upon exposure to different concentrations of NO2. The current is normalized at the value reached when each gas exposure starts.

