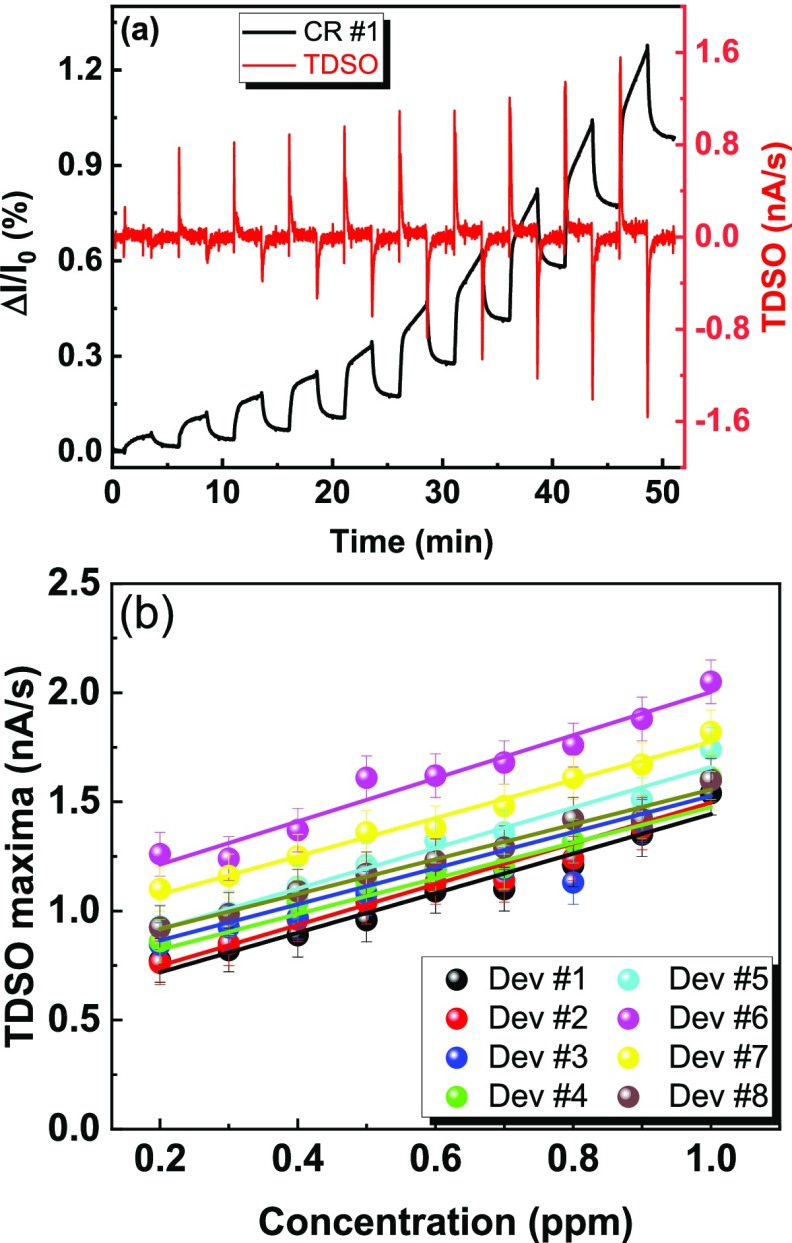
Figure 3.
(a) Real-time percentage current variation (black curve) of CR #1 during the exposure to increasing concentrations of NO2 and corresponding TDSO (red curve). Analogous results are obtained for the other seven devices (see the Supporting Information). (b) Maxima of the differential curves determined for the eight devices (see the Supporting Information) and plotted as a function of the NO2 concentration.

