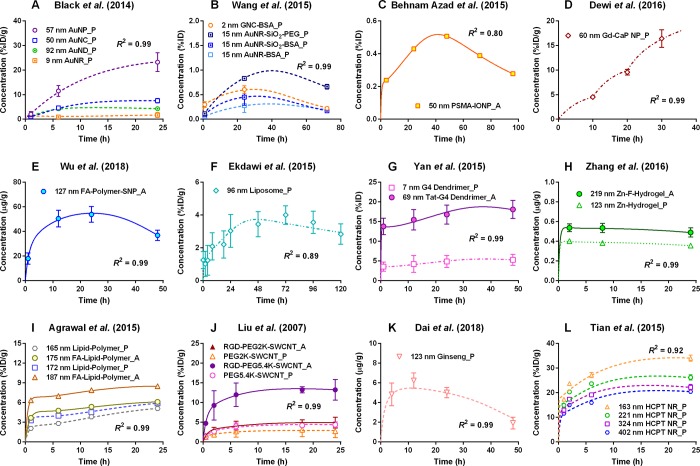
Figure 3.
Representative simulation results from the PBPK model in tumor-bearing mice intravenously administered with various types of INMs, including (A) and (B) gold,167,179 (C) iron oxide,176 (D) gadolinium (Gd)-calcium phosphate (CaP),147 and (E) silica157 NMs as well as ONMs, including (F) liposome,121 (G) dendrimer,35 (H) hydrogel,36 (I) polymeric,11 (J) single-wall carbon nanotube (SWCNT),122 (K) ginseng extract,195 and (L) anticancer drug 10-hydroxycamptothecin (HCPT)102 NMs. Tumor tissue concentrations as presented in the y-axis are expressed in the units of percent of the injected dose (%ID),%ID/g, or μg/g according to units used in the original articles. R2 is the coefficient of determination. Uppercase letters P and A followed by each legend represent passive and active targeting strategies, respectively. Abbreviations: A, active targeting; AuNP, gold nanoparticle (NP); BSA, bovine serum albumin; F, folate; FA, folic acid; G4 dendrimer, generation 4 polyamidoamine dendrimer; GNC, gold nanocluster; IONP, iron oxide NP; NC/ND/NR, nanocube/nanodisc/nanorod; P, passive targeting; PEG, polyethylene glycol; PSMA, prostate-specific membrane antigen; RGD, arginine-glycine-aspartic acid peptide; SNP, silica NP; Tat, peptide; Zn, zinc(II).

