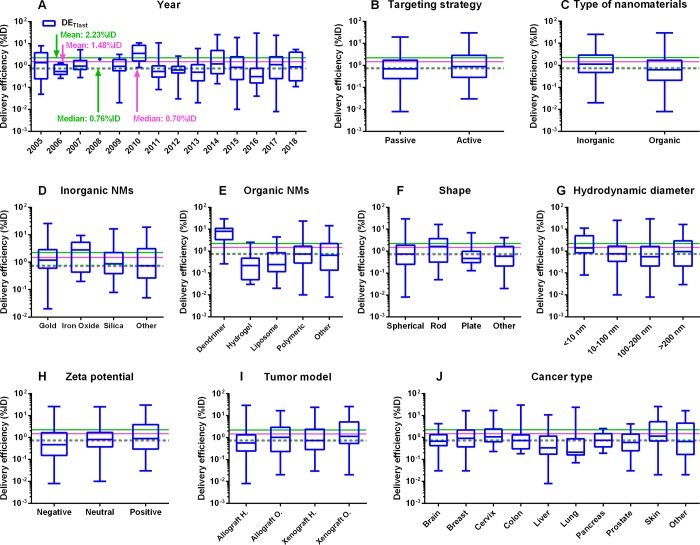
Figure 4.
Subgroup analyses on tumor delivery efficiencies estimated at the last sampling time point according to the original literature (DETlast) using our tumor-bearing PBPK model. Box-and-whisker plots of tumor delivery efficiency data (%ID) for different subgroups: (A) year, (B) targeting strategy, (C) type of nanomaterials (NMs), (D) inorganic NMs, (E) organic NMs, (F) shape, (G) hydrodynamic diameter, (H) ζ potential, (I) tumor model, and (J) cancer type. The boxes represent the 25th to 75th percentiles, and solid lines in the boxes indicate the median values. The pink dashed and solid lines denote the median and mean values of tumor delivery efficiencies derived from a previous study based on 193 published data sets from 2005 to 2015.14 The green dashed and solid lines stand for the median and mean values of tumor delivery efficiencies derived from the present study based on 376 published data sets from 2005 to 2018.

