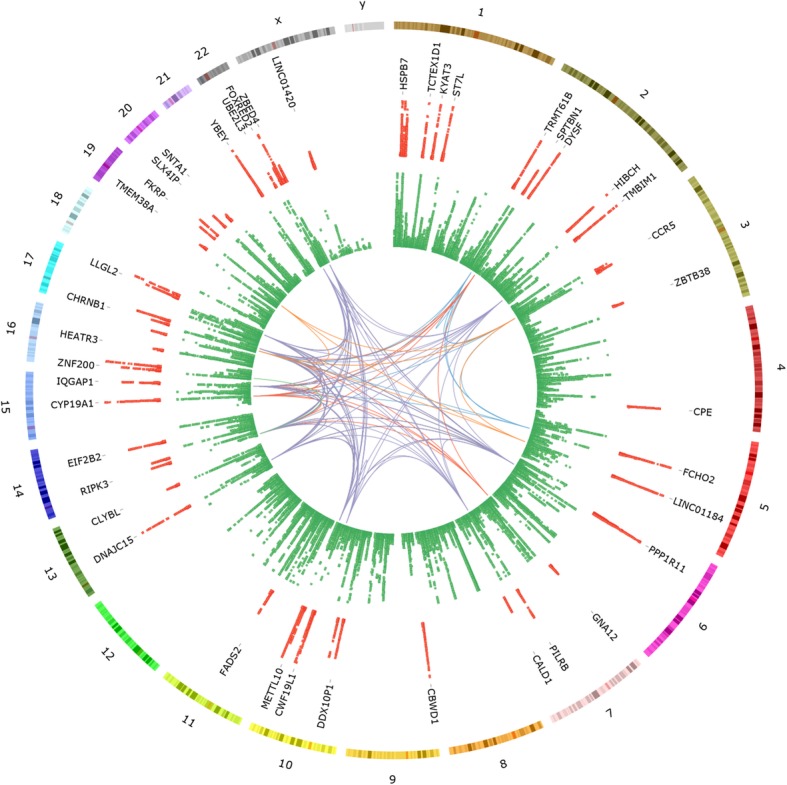
Fig. 1.

CIRCOS plot [20] displaying (from outside to inside) chromosome numbers, chromosome ideograms, scatterplot complete with gene labels representing the osteoclast eQTL associations presented in Table 1 and Additional file 1: Table S2 (red), scatterplot representing the eBMD GWAS results (green) and gene ontology (GO) biological process groupings relevant to osteoclast biology. Osteoclast eQTL and eBMD GWAS associations are displayed as −log10P values ranging from 0.01 > P > 1.0 × 10⁻¹⁵ (osteoclast eQTL) and 0.001 > P > 1.0 × 10−50 (eBMD GWAS). GO biological process groupings displayed include membrane organisation (blue), regulation of cell migration (red), regulation of catalytic activity (purple), cation transport (orange) and I-kappaB kinase/NF-kappaB signalling (green)
