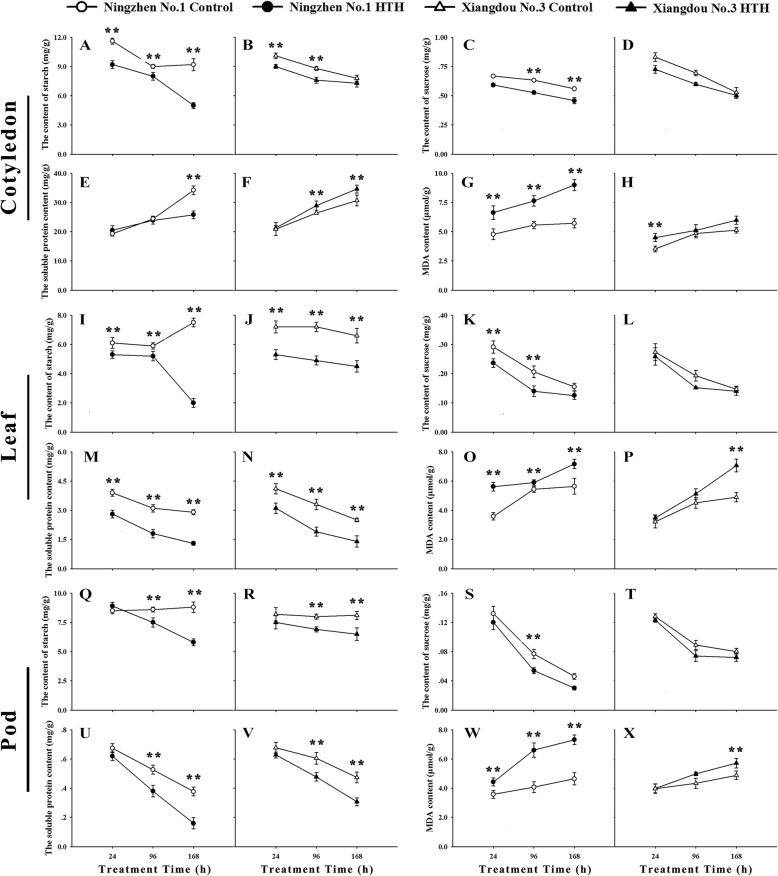
Fig. 3.
Physiological measurement in soybean cvs. Xiangdou No. 3 and Ningzhen No. 1 under HTH stress. Starch content in cotyledon (A, B), leaf (I, J) and pod (Q, R); Sucrose content in cotyledon (C, D), leaf (K, L) and pod (S, T); Soluble protein content in cotyledon (E, F), leaf (M, N) and pod (U, V); MDA content in cotyledon (G, H), leaf (O, P) and pod (W, X); Values shown are means ± SD from three biological replicates. (**, p < 0.01)

