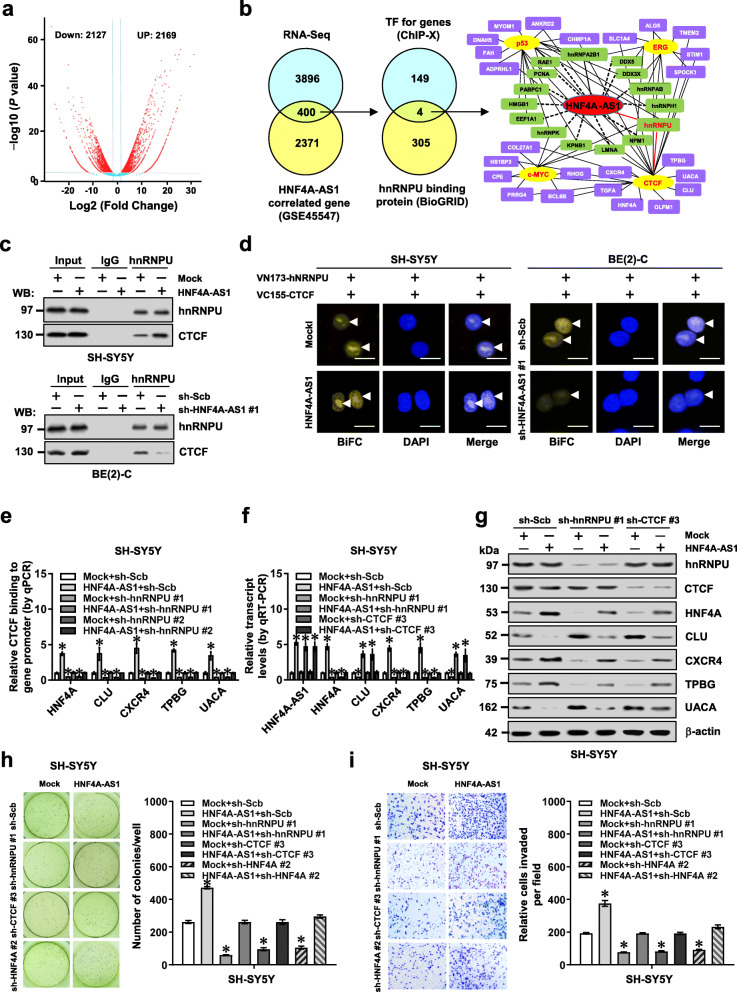
Fig. 4.
HNF4A-AS1 facilitates growth and invasion of NB cells via hnRNPU-mediated transactivation of CTCF. a Volcano plots of RNA-seq revealing alteration of gene expression (fold change > 2.0, P < 0.05) in SH-SY5Y cells stably transfected with empty vector (mock) or HNF4A-AS1. b By analyzing with ChIP-X program and BioGRID database, venn diagram (left panel) showing identification of hnRNPU-interacting transcription factors (TFs) regulating genes altered in RNA-seq and correlated with HNF4A-AS1 in a public dataset (GSE45547). Gene network (right panel) revealing identified TFs and target genes. c Co-IP and Western blot assays indicating the interaction between hnRNPU and CTCF in SH-SY5Y and BE(2)-C cells stably transfected with mock, HNF4A-AS1, scramble shRNA (sh-Scb), or sh-HNF4A-AS1 #1. d Confocal images of BiFC assay showing direct interaction between hnRNPU and CTCF (arrowheads) within SH-SY5Y and BE(2)-C cells co-transfected with pBiFC-VN173-hnRNPU and pBiFC-VC155-CTCF, and those stably transfected with mock, HNF4A-AS1, sh-Scb, or sh-HNF4A-AS1 #1. Scale bars, 10 μm. e ChIP and real-time qPCR (normalized to input) assays indicating the CTCF enrichment on target gene promoters in SH-SY5Y cells stably transfected with mock or HNF4A-AS1, and those co-transfected with sh-hnRNPU (n = 5). f and g Real-time qRT-PCR (f, normalized to β-actin, n = 4) and Western blot (g) assays showing the levels of HNF4A-AS1, hnRNPU, CTCF, and target genes in SH-SY5Y cells stably transfected with mock or HNF4A-AS1, and those co-transfected with sh-Scb, sh-hnRNPU #1, or sh-CTCF #3. h and i Representative images (left panel) and quantification (right panel) of soft agar (h) and matrigel invasion (i) assays indicating anchorage-independent growth and invasion of SH-SY5Y cells stably transfected with mock or HNF4A-AS1, and those co-transfected with sh-hnRNPU #1, sh-CTCF #3, or sh-HNF4A #2 (n = 5). ANOVA compared the difference in e, f, h, and i. *P < 0.05 vs. mock+sh-Scb. Data are shown as mean ± s.e.m. (error bars) and representative of three independent experiments in c–i

