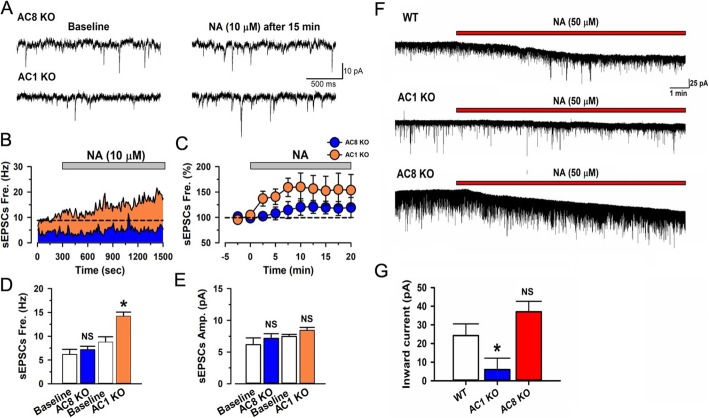
Fig. 4.
NA induced enhancement of glutamatergic transmission is blocked in different type of adenylyl cyclase knockout mice. a Sample traces of sEPSCs before and after the application of NA (10 μM in 15 min) in AC8 KO or AC1 KO mice. b Time course of sEPSCs for NA (10 μM) application in sample neurons of an AC8 or AC1 KO mice. c Averaged time course of sEPSCs for NA application from AC8 KO or AC1 KO mice. d Averaged frequency of sEPSCs with application of NA in AC8 KO or AC1 KO mice (Baseline in AC8 KO mice: 6.17 ± 1.05 Hz; AC8 KO mice: 7.17 ± 0.73 Hz, n = 7; Baseline in AC1 KO mice: 8.79 ± 1.08 Hz; AC1 KO mice: 14.22 ± 0.85 Hz, n = 6.). NS indicates no statistical significance between Baseline and AC8 KO mice. *P < 0.05, baseline vs. AC1 KO. Paired t-test. e Averaged amplitude of sEPSCs with application of NA in AC8 KO or AC1 KO mice (Baseline in AC8 KO mice: 7.75 ± 0.11 pA; AC8 KO mice: 8.21 ± 0.47 pA, n = 7; Baseline in AC1 KO mice: 7.46 ± 0.35 pA; AC1 KO mice; 8.43 ± 0.46 pA, n = 6). NS indicates no statistical significance between Baseline and AC8 KO mice or AC1 KO mice. Paired t-test. f Sample traces showing NA could induce inward currents in WT and AC8 KO mice but not in AC1 KO mice. G, The summarized data showing NA induced inward currents in WT or AC8 KO but not AC1 KO mice (WT: 21.28 ± 6.23 pA, n = 16; AC1 KO mice: 6.01 ± 6.13 pA, n = 8, AC8 KO mice: 37.013 ± 5.63 pA, n = 8). *P < 0.05, AC1 KO vs. WT and AC1 vs. AC8 KO mice. NS indicates no statistical significance between Baseline and AC8 KO mice. One-Way ANOVA

