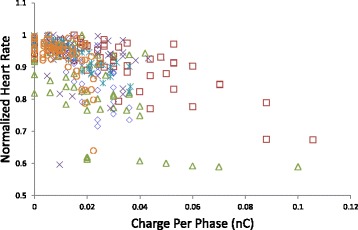
Fig. 3.

Stimulus intensity-heart rate profiles. The recorded normalized heart rate during stimulation trials was plotted against the stimulus charge per phase for all animals (n = 6, animals represented by different markers). There was generally an intensity threshold for eliciting a heart rate drop that differed among animals. The change in heart rate per change in charge also differed. Data from all animals were included without omissions, and data from all waveforms are pooled. Because stimulus charge per phase is the product of pulse width and amplitude, charge was used to represent stimulus intensity
