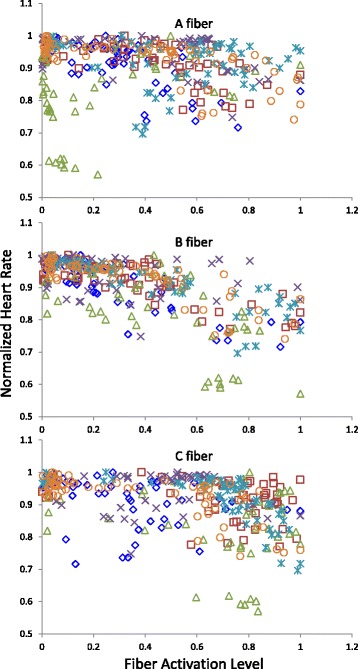
Fig. 4.

Vagal activation-heart rate profiles. The recorded heart rate was plotted against the resulting nerve fiber activation levels from the same stimulation trial. The same data set as in Fig. 3 was used. Data for all animals are presented (n = 6, animals represented by different markers). Both the heart rate and fiber activation data were normalized
