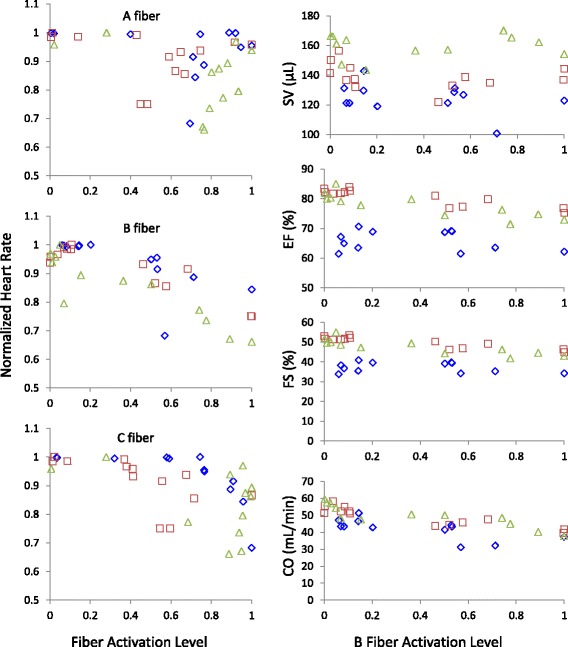
Fig. 5.

Vagal activation-heart activity profiles. Left) Normalized heart rate was plotted against normalized fiber activation level from the same stimulation trial. Right) Various measures of heart activity were calculated from ultrasound recordings and plotted against B fiber activation. The data in this figure are from a separate group of animals (n = 3, animals represented by different markers), presented without omission
