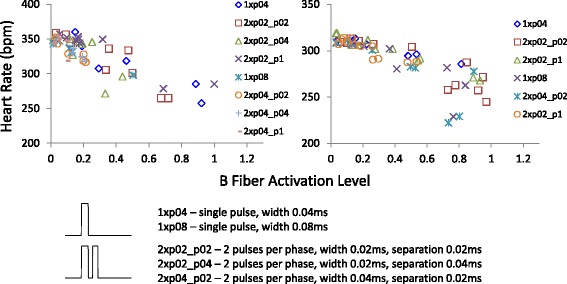
Fig. 6.

B fiber-heart rate profiles with different stimulus waveforms. Raw heart rate was plotted against B fiber activation with different stimulus waveforms denoted. Though different waveforms produced variable nerve activation patterns and variable effects on the heart rate, the B fiber and heart rate relationship appeared consistent. The two plots were from two different animals. Waveform legend is explained with example waveforms
