
Fig. 3.
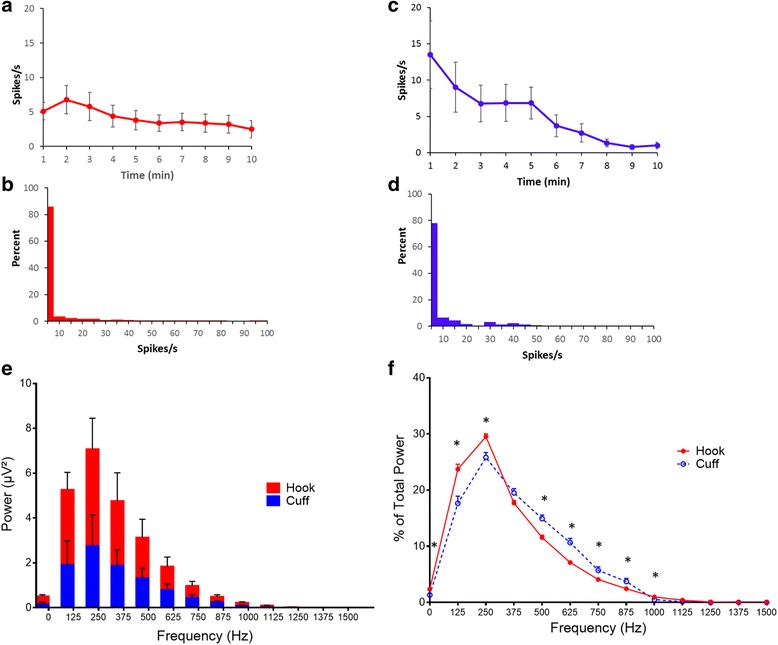
Comparison of neural activity recorded with hook and cuff electrodes. a Spikes rate of the neural events recorded with the hook electrode. b Rate distribution was calculated as overall percent of spike rate within 1 min segments over the 10-min recording with hook electrode. c Spikes rate of the neural events recorded with the cuff electrode. d Rate distribution was calculated as overall percent of spike rate within 1 min segments over the 10-min recording with cuff electrode. e FFT analysis of the 10 min recordings obtained with hook (red) or cuff (blue) electrode (Two-way ANOVA p = 0.0003). f Percentage breakdown of the frequencies recorded with the hook (red, closed circle solid line) and cuff (blue, open circle, dashed line)