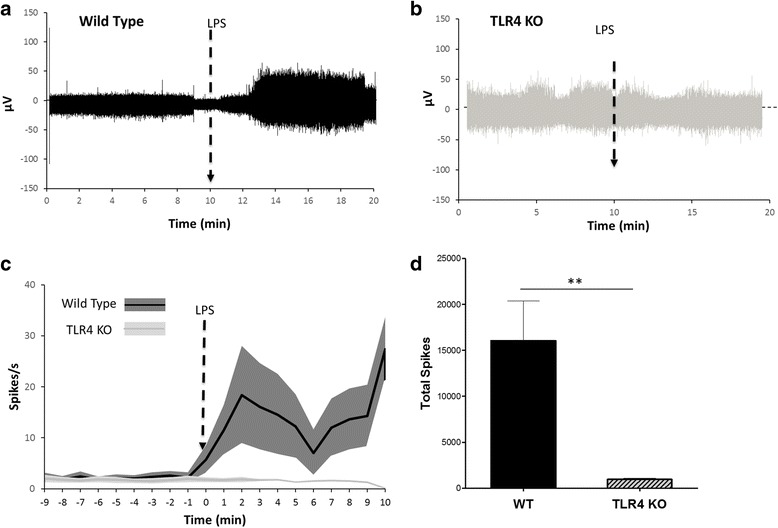
Fig. 7.

Time course of LPS-induced neurogram in wild type and TLR4 KO mice. Representative neurogram in a) wild type and b) TLR4 KO mice. The arrow represents the time of ip injection of 8.0 mg/kg LPS. c Spikes rate of the neural events recorded in wild type (n = 13) and TLR4 KO (n = 4). There is a significant difference between the post injection responses between the TLR4 KO and wild type (t test, p < 0.0001). d Total spike count over the entire 10-min recording is significantly different between wild type and TLR4 KO mice (Mann-Whitney, p < 0.001, U = 00)
