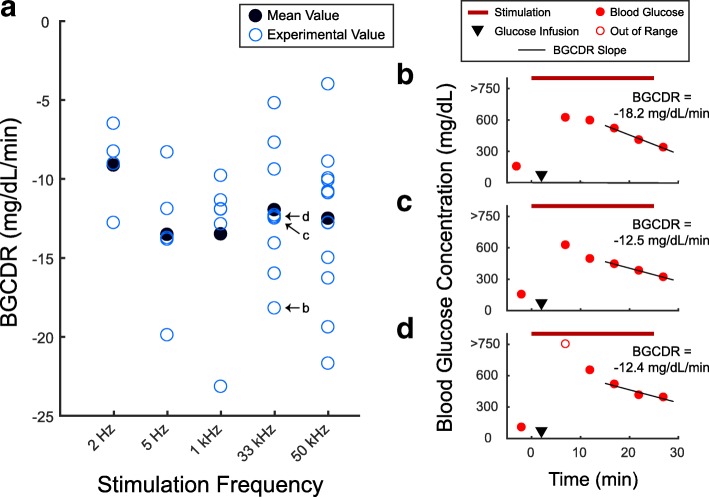
Fig. 5.
Changes in blood glucose concentration. a The blood glucose concentration decrease rate (BGCDR) at the applied stimulation frequencies. b Blood glucose concentration (BGC) measurements and BGCDR (slope) for the trial shown in Fig. 2b. c BGC and BGCDR measurements for the trial shown in Fig. 2c. d BGC and BGCDR measurements for the trial shown in Fig. 2d. BGC measurements above 750 mg/dL were not available due to the limitations of the glucometer

