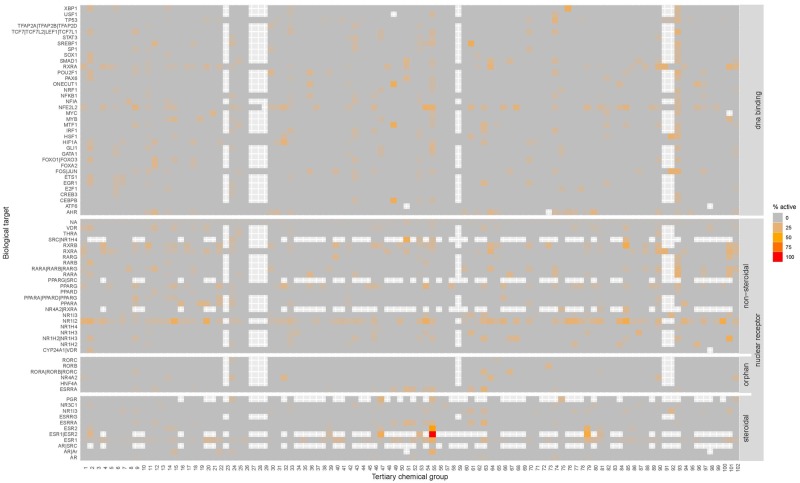
Figure 3.
Heatmaps of the biological activity of the 102 tertiary chemical groups within “DNA binding” and “nuclear receptor” target families. Each target (displayed on the y-axes with labels) is covered by 1–11 assays. The gradient corresponds to an increasing percentage of chemicals within the chemical group that showed activity in the different assays of that target. White spots mean that < 3 chemicals were tested in all assays of that target. Gray spots mean that none of the chemicals in the chemical group was active in the assays of that target. The results for all target families can be interactively viewed through www.https://ilsi.eu/exploitation-of-toxcast-data-on-food-chemicals-for-safety-risk-assessment/ (last accessed January 30, 2020).

