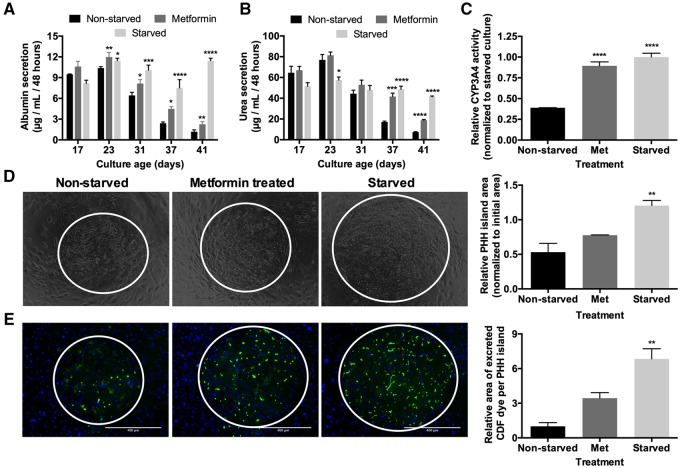
Figure 3.
Metformin treatment recapitulates some of the functional benefits of intermittent starvation. (A) Albumin production over time, (B) urea synthesis over time, and (C) CYP3A4 enzyme activity after 6 weeks of culture in nonstarved, starved (as described in Figure 1B), and metformin-treated micropatterned cocultures (MPCCs). Metformin treatment followed the same schedule as starvation except that cultures were treated with metformin in serum/hormone-supplemented culture medium instead. (D) Phase contrast images of MPCCs under various treatments as described above after 6 weeks of culture. White circles outline PHH islands. Graph on the right quantifies relative PHH island area in MPCCs under various treatments after 6 weeks of culture. (E) Functional bile canaliculi in PHHs within MPCCs under various treatments as assessed by the excretion of the CDF dye. Left: images of representative bile canaliculi in PHH islands within the 3 conditions. Right: relative area of excreted CDF in PHH islands within the 3 conditions after 6 weeks of culture. Data are normalized to the nonstarved controls. Scale bars on images represent 400 µm. *p < .05, **p ≤ .01, ***p ≤ .001, and ****p ≤ .0001 relative to the nonstarved control. Abbreviation: PHH, primary human hepatocyte.

