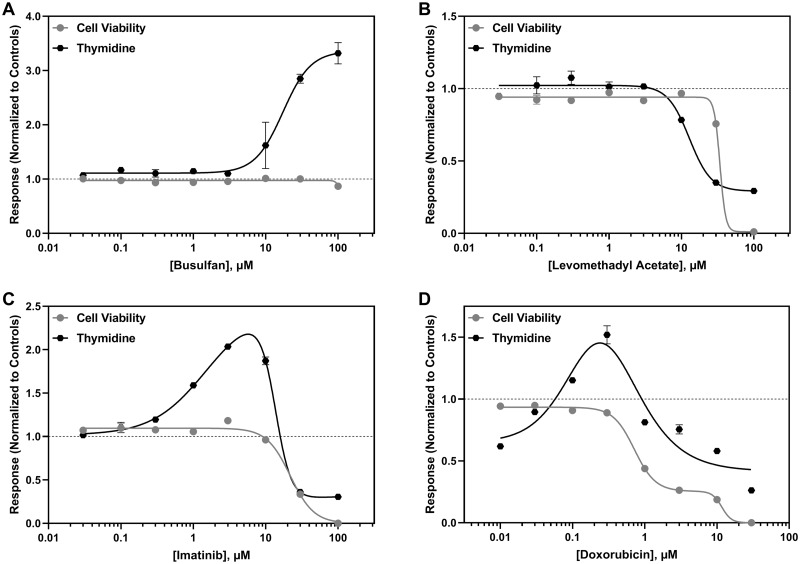
Figure 5.
Representative concentration-dependent effects on thymidine metabolism in hiPSC-CM following cardiotoxicant exposure. Thymidine ( ) and cell viability (●) are shown for (A) busulfan, (B) levomethadyl acetate, (C) imatinib, and (D) doxorubicin. The x-axis is the drug concentration (µM) and the y-axis is the solvent control-normalized (fold change) value for thymidine or cell viability. Data represent mean ± SEM (n = 3). If not shown, error bars are smaller than the size of the symbol.

