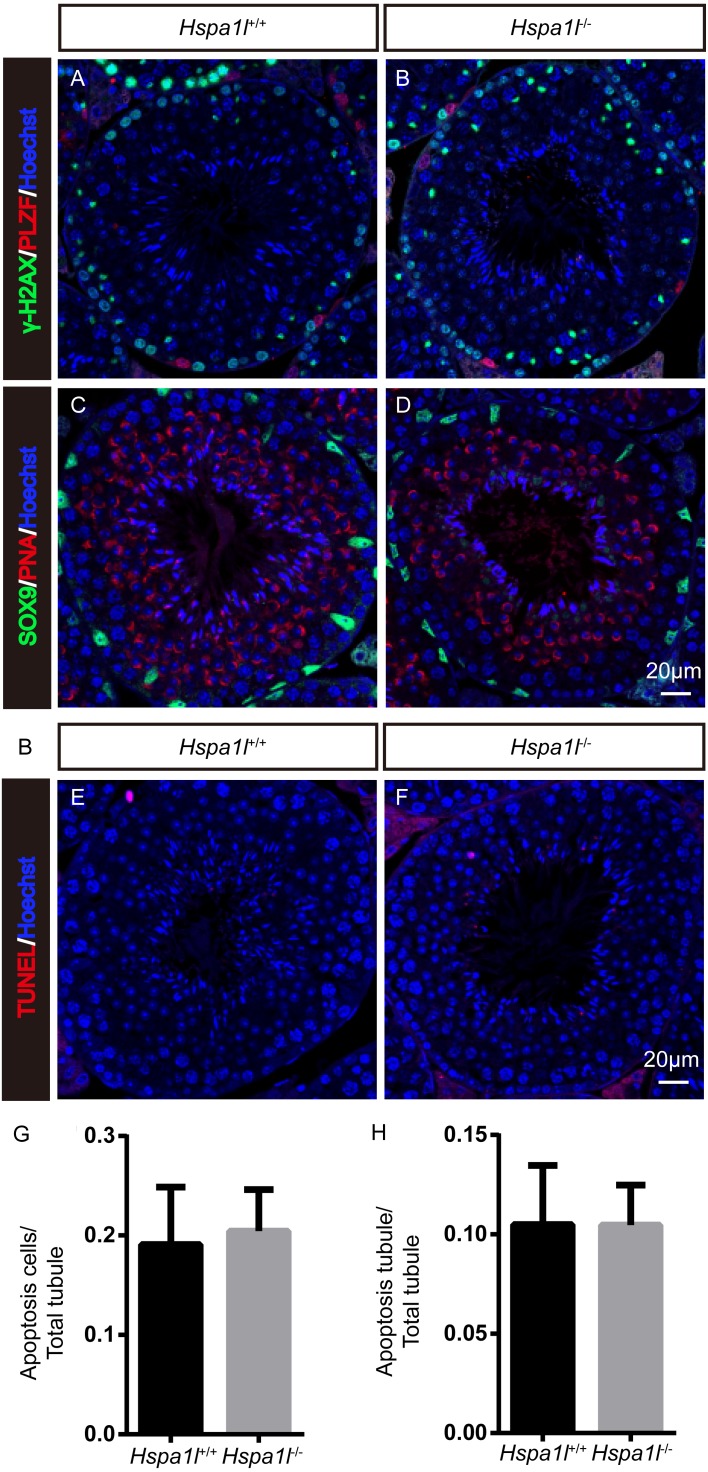
Figure 4. Immunofluorescence and apoptosis analysis of Hspa1l+∕+ and Hspa1l−∕− testes.
(A–D) The PLZF, γ-H2AX, PNA and Sox9 signals shows the locations of spermatogonia, spermatocytes, spermatids and Sertoli cells in testis sections from both Hspa1l+∕+ and Hspa1l−∕− mice, respectively. (E–F) Testicular sections of TUNEL assay in Hspa1l+∕+ and Hspa1l−∕− mice; (G) Average apoptotic cells per seminiferous tubule in Hspa1l+∕+ and Hspa1l−∕− testicular sections; (H) Average apoptotic cells per seminiferous tubules in Hspa1l+∕+ and Hspa1l−∕− testicular sections, n = 5.

