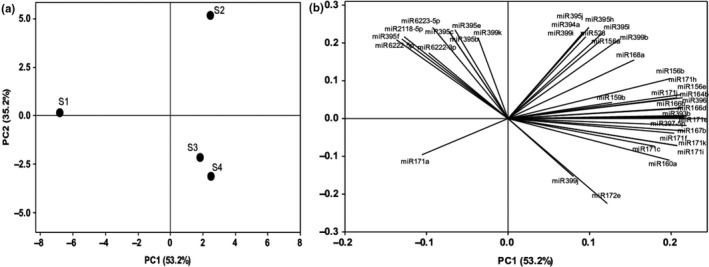
Figure 6.

Distance biplots from 39 miRNAs found in sugarcane roots segments during aerenchyma formation. (a) The centroid separation corresponds to data average for roots segments in the plane defined by the first and second main components (PC1 and PC2). Percentage values in parentheses (x and y axes) show the proportion of the variance explained by axis. (b) The plot of the PC1 and PC2 loading vectors, describing the relationship among the miRNAs and roots segments. The mRNAs analyzed from Table 1 were expressed in descriptor vectors all PCs loading from PC1 and PC2 showed in Table S10. (n = 3)
