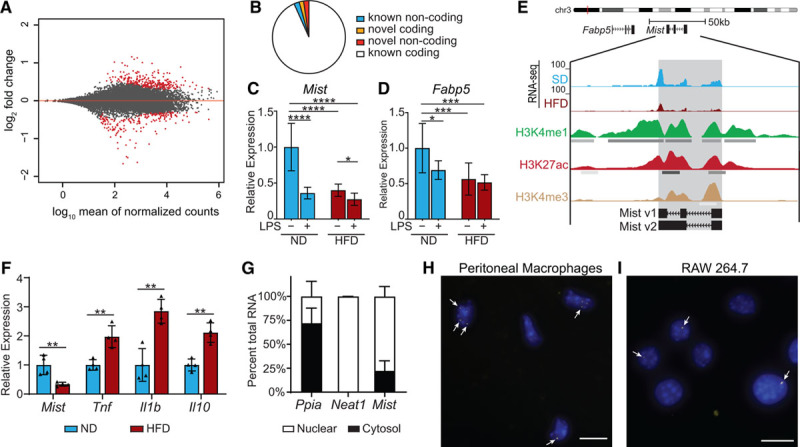
Figure 1.

Macrophage inflammation-suppressing transcript (Mist) is suppressed in macrophages by high-fat diet (HFD) in vivo and LPS (lipopolysaccharide) treatment in vitro. A, MA plot of log2 ratio fold change (HFD/normal diet) vs normalized mean counts. Points for differentially expressed genes (false discovery rate <0.1) are in red. B, Classification of differentially expressed genes. C and D, Real-time quantitative polymerase chain reaction (RT-qPCR) analysis of Mist and Fabp5 in peritoneal macrophages from normal diet (ND) or HFD mice treated with or without LPS (100 ng/mL) for 3 h (n=6 mice/group). E, Representative tracks of our RNA-seq data at Mist genomic locus, and chromatin immunoprecipitation-seq tracks of overlapping histone modifications from bone marrow–derived macrophage (BMDMs; ENCODE [Encyclopedia of DNA Elements] Consortium). F, RT-qPCR analysis of genes expressed in adipose tissue macrophages (ATMs) from mice fed ND or HFD for 16 wk (n=4 mice/group). G, Nuclear localization of Mist relative to cytosol in macrophages. Subcellular fractionation of RAW 264.7 cells followed by RT-qPCR for indicated genes, including Neat1, a known nuclear lncRNA. H and I, RNA-fluorescent in situ hybridization in mouse peritoneal macrophages and RAW cells for Mist (yellow foci, denoted by white arrows); nuclei are counterstained with DAPI (blue). Scale bar represents 10 μm. Bar graphs represent mean±SD. H3K27ac indicates lysine-27 acetylation; and H3K4me1, H3 lysine-4 monomethylation. *P<0.05, **P<0.01, ***P<0.001, and ****P<0.0001 calculated using Fisher least significant difference test on log-transformed expression values.
