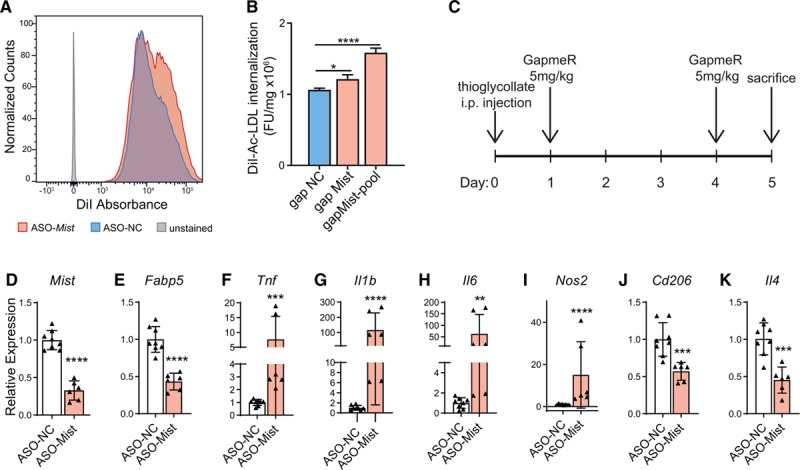
Figure 3.

Macrophage inflammation-suppressing transcript (Mist) silencing increases uptake of modified LDL (low-density lipoprotein) and affects macrophage gene expression profile in vivo. A, Histogram showing fluorescence-activated cell sorter absorbance of DiI-labelled ac-LDL (acetylated LDL) after GapmeR ASO-mediated Mist knockdown in RAW 264.7 cells. B, Alternative spectrofluorometric assay of DiI-ac-LDL absorbance in RAW macrophages after Mist knockdown from a separate experiment. Bars represent mean+SD of normalized DiI-ac-LDL internalization, n=3. C),Experimental protocol for Mist knockdown in vivo. GapmeR was injected intraperitoneally (5 mg kg−1) in mice with control GapmeR (ASO-NC) and mice with Mist-target GapmeR (ASO-Mist) on days 1 and 4 after thioglycollate injection, and PMs were harvested on day 5. D–K, Real-time quantitative polymerase chain reaction (RT-qPCR) analysis of gene expression in peritoneal macrophages collected from mice injected with Mist-targeted (ASO-Mist) or control (ASO-NC) GapmeR. ASO-Mist Gapmer caused significant decrease in Mist expression (D), as well as neighboring gene Fabp5 (E). increased expression of M1 genes Tnf (F), Il1b (G), Il6 (H), and Nos2 (I) were observed, as well as decreases in M2 macrophage markers Cd206 (J) and Il4 (K). n=4 and n=3 mice for ASO-NC and ASO-Mist-injected mice, respectively. Macrophages were processed in duplicate per mouse, for total of n=8 and n=6 for ASO-NC and ASO-Mist, respectively. Bar graphs represent mean±SD. *P<0.05, **P<0.01, ***P<0.001, and ****P<0.0001 calculated using 1-way ANOVA followed by Tukey multiple comparisons test (B) or Student t test on log-transformed expression values (D–K).
