
Figure 5.
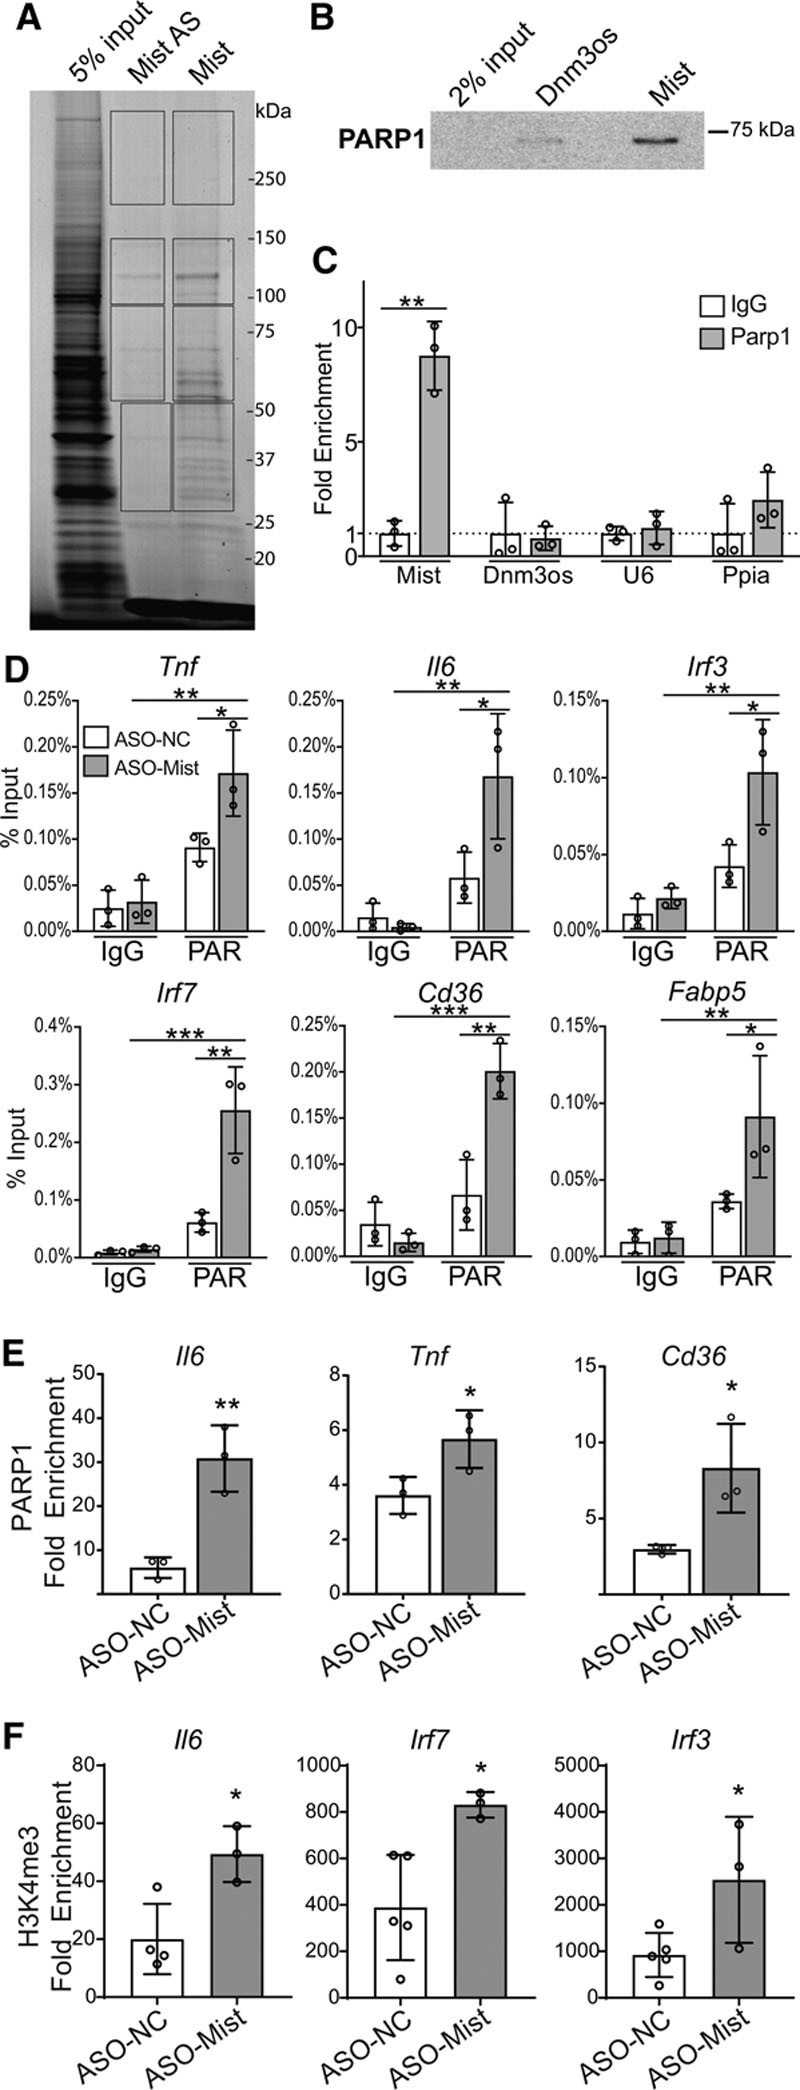
Macrophage inflammation–suppressing transcript (Mist) interacts with nuclear proteins to regulate gene expression and promoter histone poly(ADP)-ribosylation. A, RNA pulldown of Mist-interacting protein partners. Biotinylated Mist sense (Mist) and antisense control (Mist-AS) RNA transcripts were incubated with nuclear lysates from PMs, fractionated on SDS-PAGE gel and visualized with Simply Blue Safestain. Protein bands in different regions from each lane (indicated by rectangular boxes) were subjected to mass spectrometry to identify Mist-interacting proteins. B, Western blot of RNA-pulldown protein using antibodies specific for PARP1 (poly(ADP-ribose) polymerase 1). RNA-protein complexes were run on SDS-PAGE gel and probed using indicated antibodies. Dnm3os probe used as a control. C, Cross-link RNA-immunoprecipitation using PARP1 antibody or isotype control (IgG), followed by RT-qPCR (real-time quantitative polymerase chain reaction) for detection of associated RNAs. Dnm3os, U6, and Ppia used as controls. D, Chromatin immunoprecipitation (ChIP)-qPCR of poly(ADP)-ribosylation (PAR) at promoters of indicated genes (n=3). RAW 264.7 cells were treated with Mist-targeting or nontargeting ASOs. E, ChIP-qPCR for PARP1 enrichment at promoters of indicated genes. ChIP assay was performed using PAR-optimized protocol (see Methods), n=3 per group. F, ChIP-qPCR of H3K4me3 enrichment at promoters of indicated genes in RAW cells transfected with ASO-Mist (n=3) or nontargeting ASO (ASO-NC; n=5). RAW 264.7 cells were treated with Mist-targeting or nontargeting ASOs. Fold enrichment values represent enrichment relative to IgG. Bar graphs represent mean values, error bars=SD. ns P>0.05, *P<0.05, **P<0.01, and ***P<0.001 calculated using Student t test (C, E, and F) or 2-way ANOVA followed by Tukey multiple comparisons test (D).