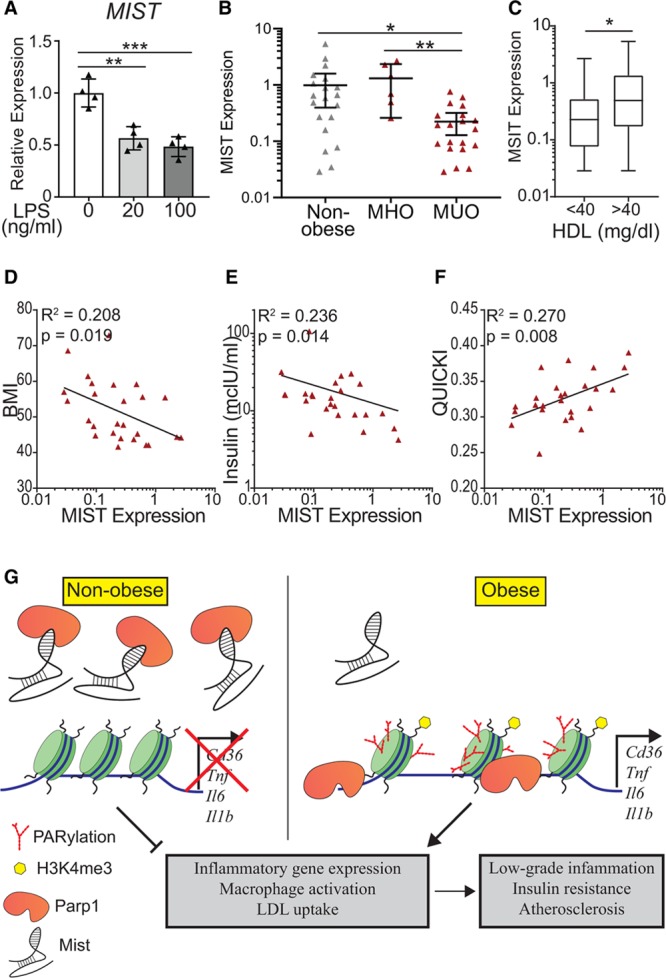
Figure 6.

Macrophage inflammation-suppressing transcript (Mist) expression in human macrophages. A, Quantitative polymerase chain reaction (qPCR) analysis of MIST expression in THP-1 macrophages treated with LPS (lipopolysaccharide) for 3 h. n=4, bar graphs represent mean±SD. B, MIST expression in stromal vascular fraction (SVF) of adipose tissue samples collected from patients with obesity undergoing bariatric surgery and nonobese donors. SVF was isolated and RNA was extracted. qPCR was performed using primers for MIST homolog. Obese patients were stratified into metabolically healthy obese (MHO, n=6) and metabolically unhealthy obese (MUO, n=19) pools. MHO was defined by the following criteria: body mass index (BMI) >40, triglyceride <150 mg/dL, fasting glucose <101 mg/dL, fasting insulin <10 mcIU/mL, and HbA1C <5.7% (39 mmol/mol). Bar graphs represent mean±95% CI. C, MIST expression in patients binned by high-density lipoprotein (HDL) levels independent of obesity; HDL <40 mg/dL (n=21) and HDL >40 mg/dL (n=20). D–F, MIST expression within obese cohort in relationship with physiological measurements, including BMI (D), fasting insulin levels (E), and QUICKI (Quantitative Insulin-Sensitivity Check Index) measurement (F). Lines represent nonlinear semilog or log-log regression. (G) Model for Mist regulation of gene expression in macrophages and downstream effects on macrophage phenotype during obesity. Green cylinders represent nucleosomal histones, red branched marks represent PARylation, and yellow hexagons symbolize histone posttranslational modification H3K4me3. *P<0.05, **P<0.01, and ***P<0.001 calculated using 1-way ANOVA followed by Tukey multiple comparisons test (A–B) or Student t test (C) on log-transformed expression values. Gaussian distribution was verified by D’Agostino and Pearson normality test for values of log(Mist), BMI, log(Insulin), and QUICKI before all comparison and correlation tests.
