
Figure 5. Conversion of trimethyl-2AEP to methyldehydrofosmidomycin by DfmD.
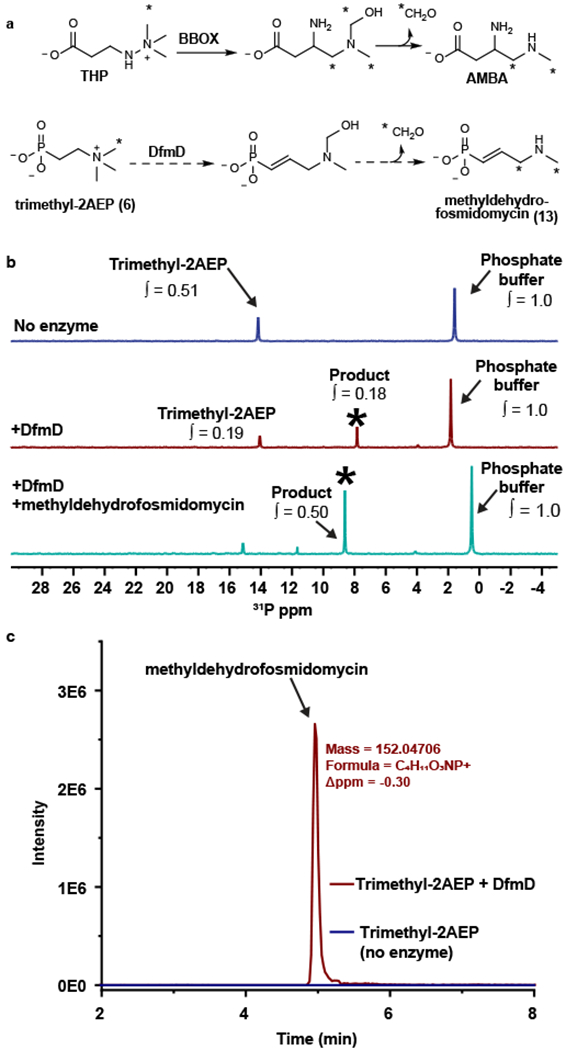
(A) The rearrangement of trimethylhydrazine-propionate (THP) to 3-amino-4-(methylamino)butanoic acid (AMBA) catalyzed by γ-butyrobetaine dioxygenase (BBOX) is shown at the top. The analogous reaction catalyzed by DfmD is shown below. (B) 31P NMR analysis of the DfmD reaction. The blue spectrum is from a no-enzyme control. The red spectrum is from a reaction containing purified DfmD. The teal spectrum is from the DfmD-containing reaction spiked with synthetic methyldehydrofosmidomycin. The asterisk marks the putative methyldehydrofosmidomycin peak. The integration values (∫) show the abundance of each compound relative to the phosphate buffer. Representative data from three independent experiments. (C) The EIC for methyldehydrofosmidomycin from the DfmD-containing reaction (red) and no-enzyme control (blue). Representative data from three independent experiments.