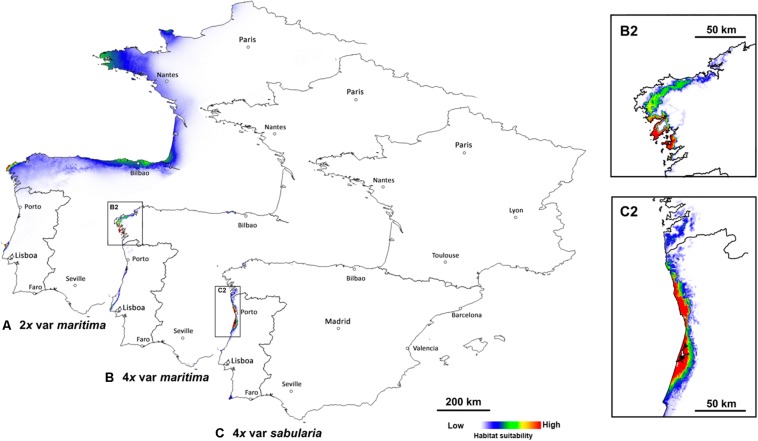
FIGURE 3.
Predicted geographic niches for (A) diploids of Jasione maritima var. maritima (2x var. maritima), (B) tetraploids of J. maritima var. maritima (4x var. maritima), plus an inset of the area with higher probability of occurrence (B2), and (C) tetraploids of J. maritima var. sabularia (4x var. sabularia), plus an inset of the area with higher probability of occurrence (C2), considering the entire distribution area. White to red color gradient represent habitats with higher and lower probability of occurrence of the cytotype, respectively.

