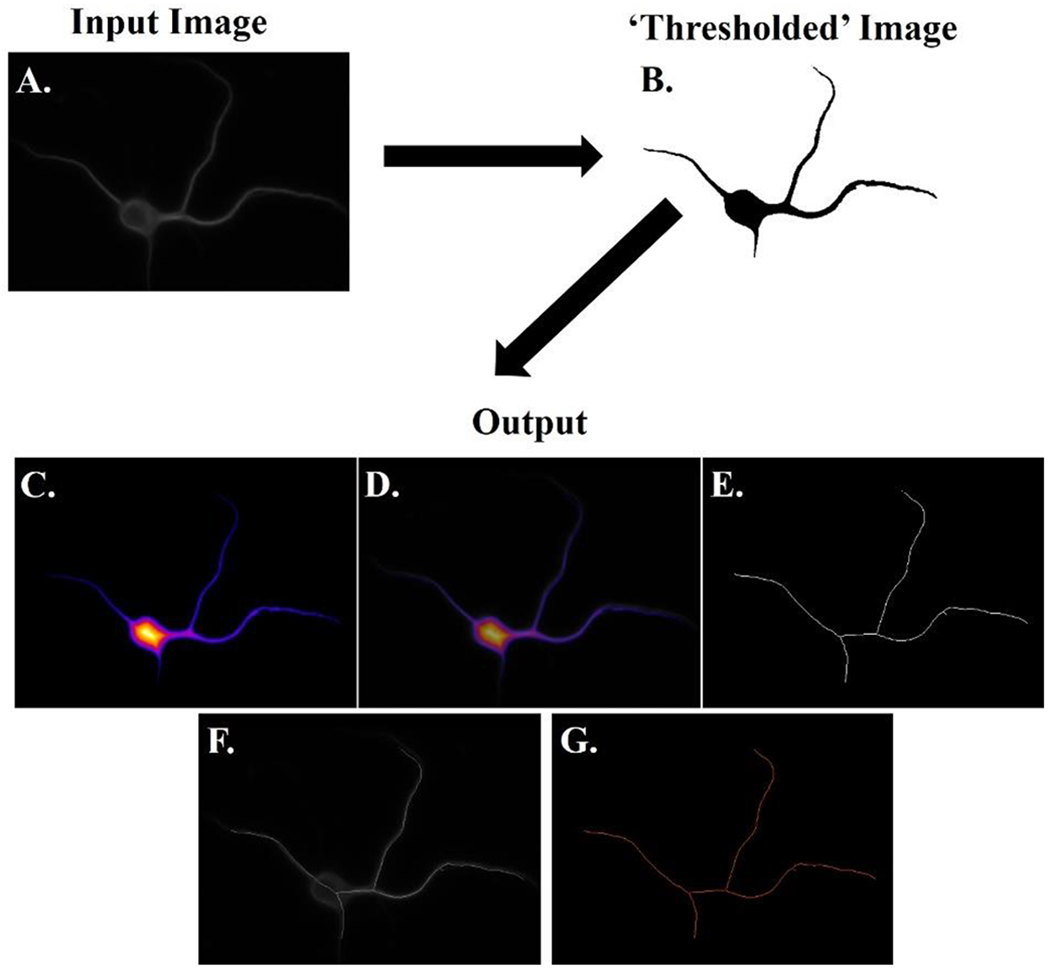
Figure 1. Schematic of algorithm workflow.

A simplified explanation of the algorithm workflow is presented. The user manually pre-processes the input image into a ‘thresholded’ binary image. This binary image is then used as the input for AutoSholl, which then returns the results of the analysis (termed output). The output shows the original image (A) followed by the ‘thresholded’ binary image (B). The local thickness heat map (darker colors correspond to smaller thicknesses) (C) is overlaid onto the original image (D) for comparison. The optimal skeleton is presented (E) and is overlaid onto the original image (F). The tagged skeleton is shown with branch points labeled in purple and all dendrites in orange (G). Overlaid images are not part of the algorithm output, but are presented here to allow for visual confirmation of results. This figure was enhanced with Photoshop for better visualization purposes by enhancing the color levels within the linear range.
