
Figure 2. Algorithm outputs for a complex dendritic field.
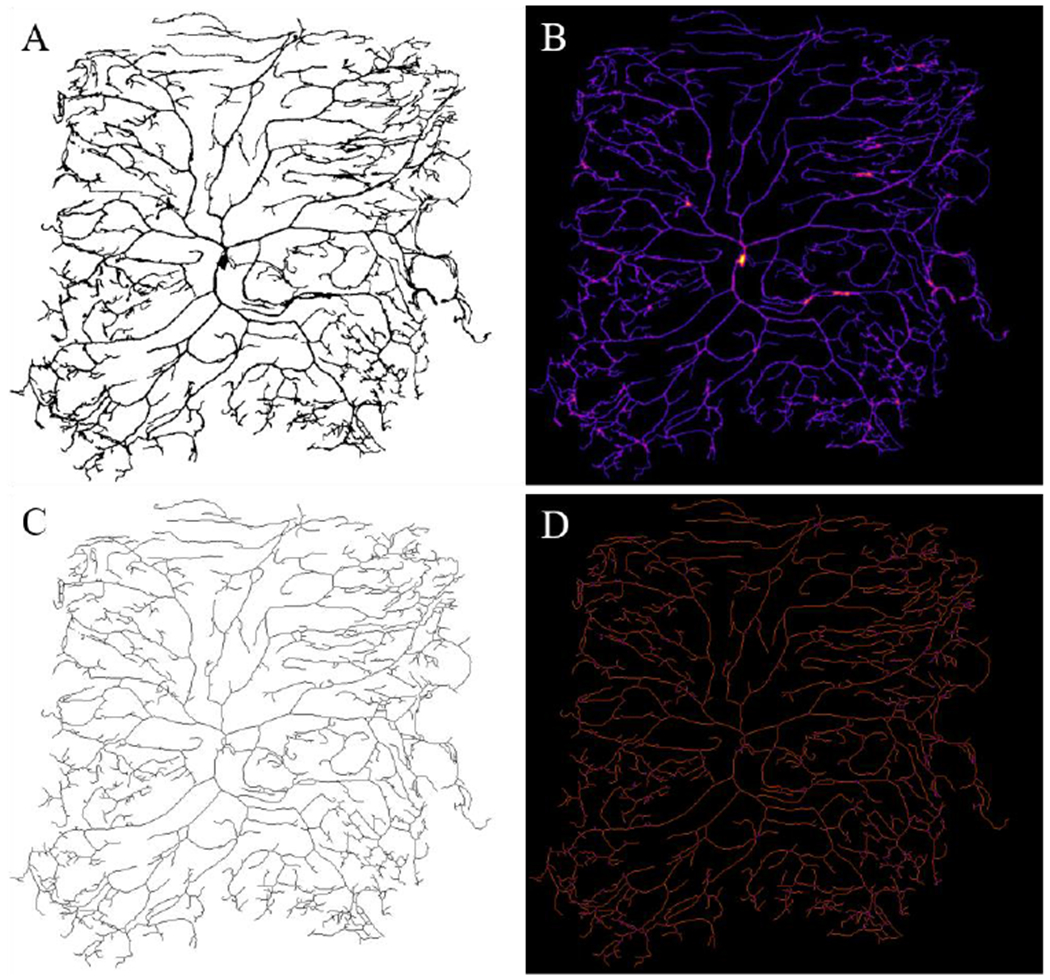
The thresholding process was previously performed, since the input image is a Drosophila neuron sample, provided with the Sholl Analysis plugin found in the standard distribution of Fiji ImageJ (Schindelin et al., 2012; Ferreira et al., 2014). The output shows the ‘thresholded’ binary image (A). The local thickness heat map (darker colors correspond to smaller thicknesses) (B) and optimal skeleton is presented (C) for the sample image. The tagged skeleton is shown with branch points labeled in purple and all dendrites in orange (D). This figure was enhanced with Photoshop for better visualization purposes by enhancing the color levels within the linear range.