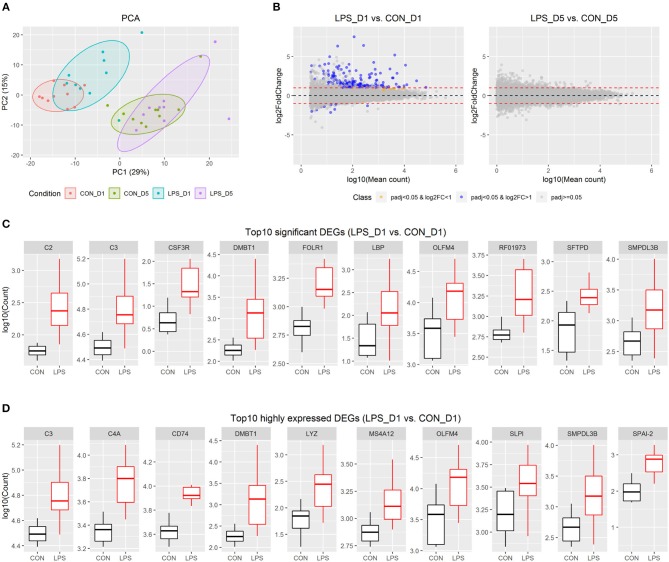
Figure 1.
Intestinal transcriptome profile in response to intra-amniotic LPS exposure. (A) Scores of the first two principle components from principal component analysis are plotted, with ellipses for the 80% confidence interval for each group. (B) MA plot showing fold change (LPS vs. CON) and mean of normalized counts for all the analyzed genes. (C) Boxplot of top 10 significant DEGs between LPS-D1 and CON-D1 groups. (D) Boxplot of top 10 highly expressed DEGs between LPS-D1 and CON-D1 groups.

