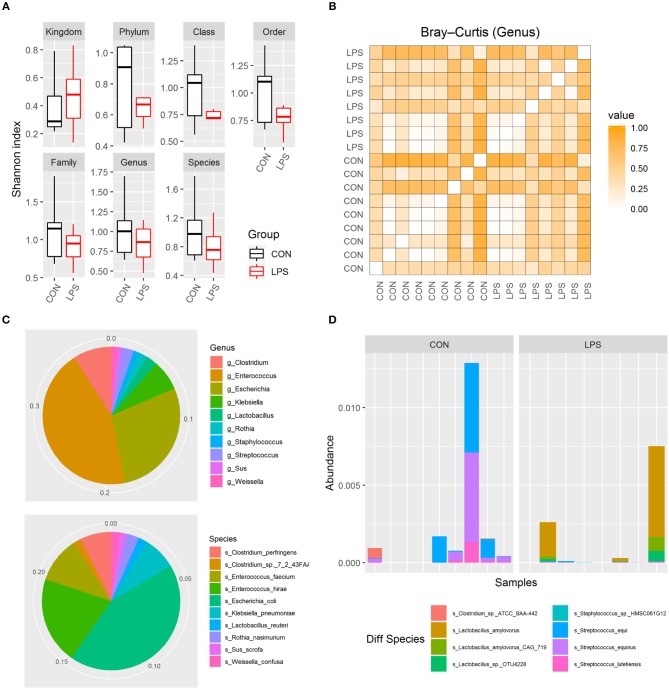
Figure 2.
Gut microbiome in LPS and CON groups on postnatal day 5. (A) Boxplot of Shannon index in two groups. (B) Heatmap derived from dissimilarity matrix of Bray–Curtis distances from all 5-day-old pigs. (C) Pie chart of top 10 abundant genus/species in all 5-day-old pigs. (D) Bar plot showing eight differential abundant species between the LPS and CON groups.

