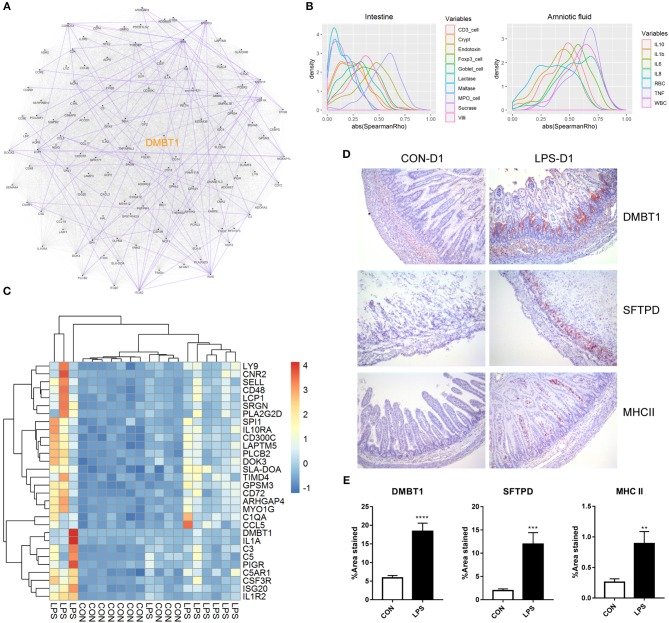
Figure 3.
Relationship and functionality of DEGs between LPS and CON groups at birth. (A) Putative co-expression network, where each node represents a gene, and each edge represents a significant correlation between gene pairs. Experimentally determined protein–protein interaction between gene pairs is highlighted in purple. Hub gene DMBT1 is highlighted in yellow. (B) Density plot of absolute Spearman ρ between DEGs and intestinal/amniotic measures. (C) Heatmap showing the relative expression of DEGs that were correlated with intestinal MPO-positive cell density and amniotic TNF-α level. (D) Representative images of distal small intestines stained with antibodies to DMBT1, SFTPD, and MHCII. (E) Significant difference of the area stained by DMBT1/SFTPD/MHCII between LPS and CON groups was revealed according to Mann–Whitney U test. Values are presented as the mean ± SEM, *P < 0.05, **P < 0.01, ***P < 0.001, ****P < 0.0001.

