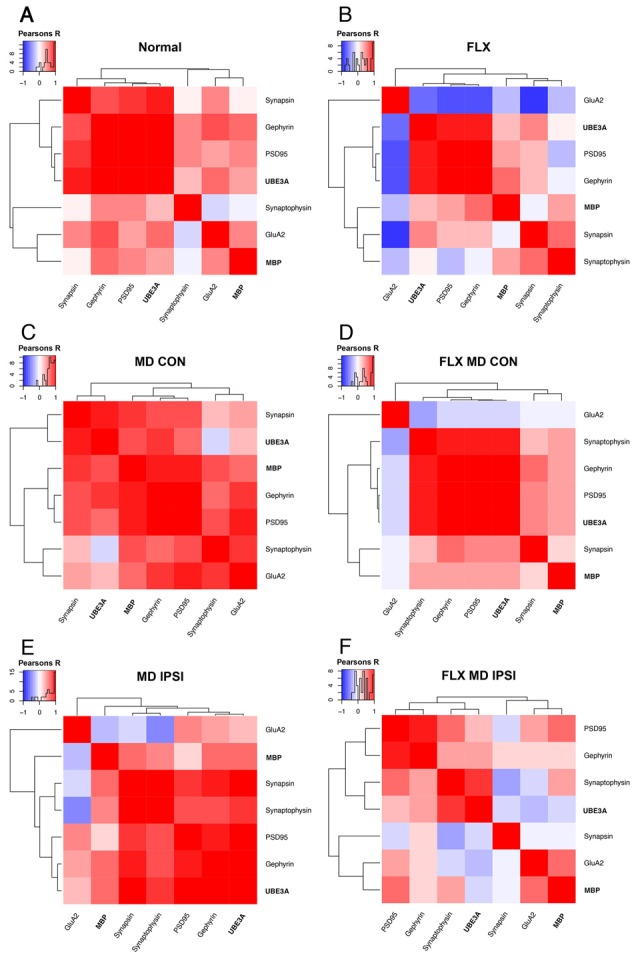
Figure 4.

Hierarchical cluster analysis of adult V1. The high dimensional pattern of protein expression changes in V1 for the deprived (contralateral) and non-deprived (ipsilateral) hemispheres were analyzed by combining the measurements of MBP and Ube3A from this study with data for GluA2, PSD95, Gephyrin, Synapsin, and Synaptophysin from our previous study (Beshara et al., 2015). Correlation matrices are plotted to show the strength and direction (blue: negative; red: positive) of the pairwise Pearson’s R correlations between proteins for each condition and hemisphere. The inset with each panel shows the color-code and distribution of R values. The order of proteins was determined using unsupervised hierarchical clustering such that proteins with stronger correlations were nearby in the matrix: (A) normal, (B) fluoxetine, (C) MD contralateral (deprived) hemisphere, (D) fluoxetine and MD contralateral (deprived) hemisphere, (E) MD ipsilateral (non-deprived) hemisphere, and (F) fluoxetine and MD ipsilateral (non-deprived) hemisphere.
