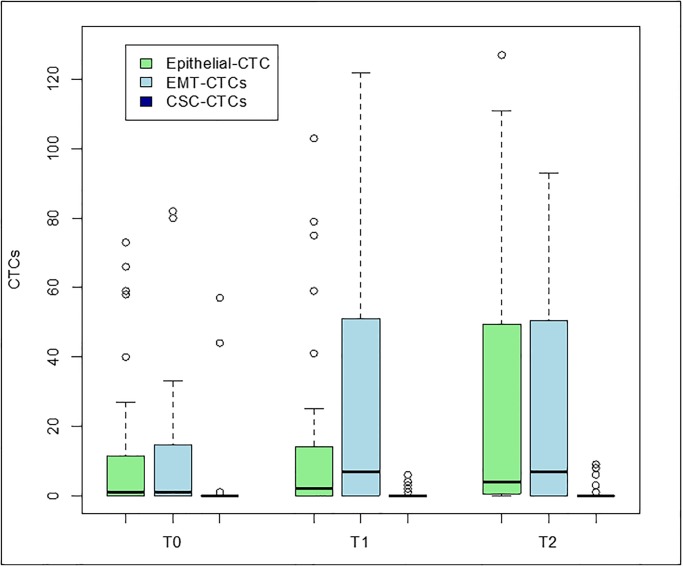
Fig 1. Epithelial CTC, EMT-CTC, and CSC-CTC levels at baseline (T0), after chemotherapy (T1), and after surgery (T2).
The bottom and the top of each box represent the 25th and 75th percentiles, and the horizontal band within the box represents the median. The upper whisker represents the 75th percentile plus 1.5 times the interquartile range. The lower whisker represents the 25th percentile minus 1.5 times the interquartile range.

