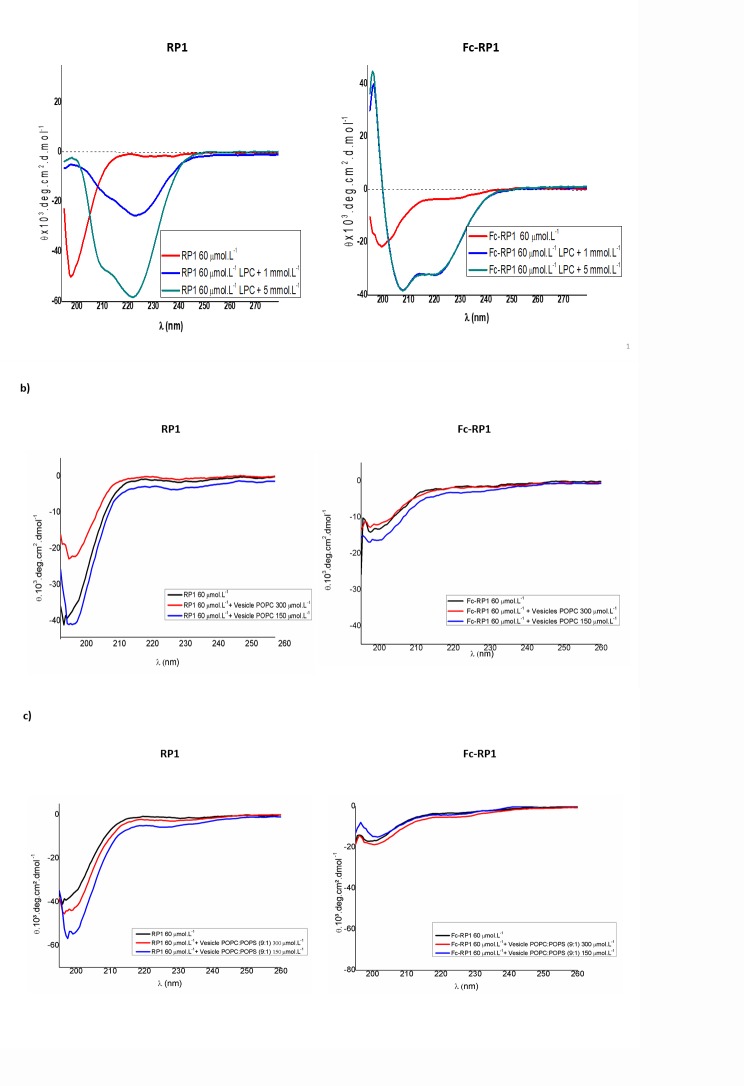
Fig 1. CD spectra of RP1 and Fc-RP1.
(a) RP1 and Fc-RP1 in PBS solution and LPC at concentrations of 1 and 5 mmol L-1. (b) Peptides in POPC unilamellar vesicles at the concentrations of 300 and 150 μmol L-1 of lipids. (c) Peptides in POPC: POPS vesicles (9:1 / m:m) also at the concentrations of 300 and 150 μmol L-1 of lipids. The peptides were evaluated in concentration of 60 μmol L-1 dissolved in PBS.

