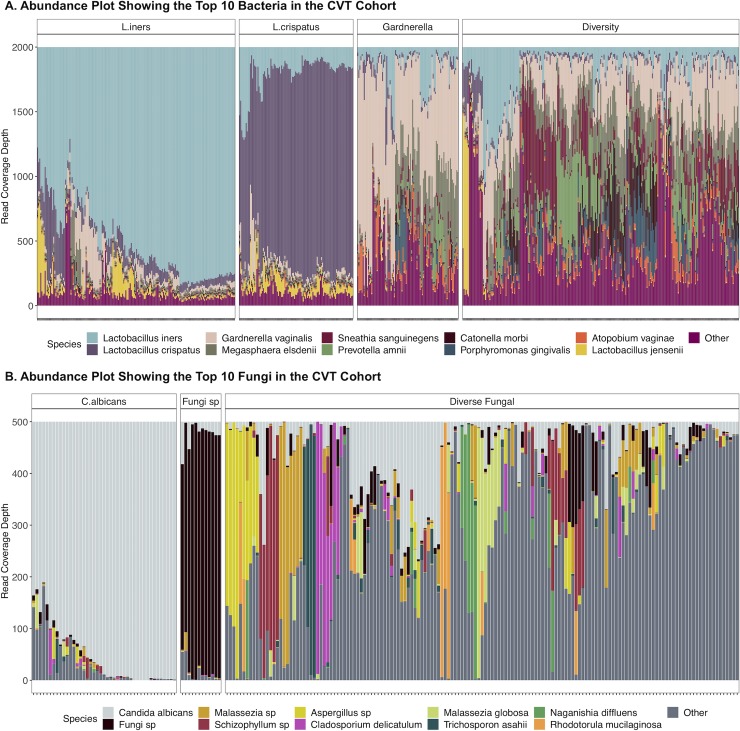
Fig 3. Bacterial and fungal communities within the study cohort.
A. The abundance plot represents the bacterial community structure of the study subjects. The operational taxonomic units (OTUs) were collapsed at the species level and the top 10 species are presented. Figure boxes labeled: L. iners, L. crispatus, Gardnerella and Diversity represent the vaginal community state types (CSTs) identified using hierarchical clustering. B. Heatmap showing the top 20 fungal species identified within the study subjects. C. albicans has the highest mean abundance. There were three vaginal fungal community states identified using hierarchical clustering as indicated by the separate boxes.

