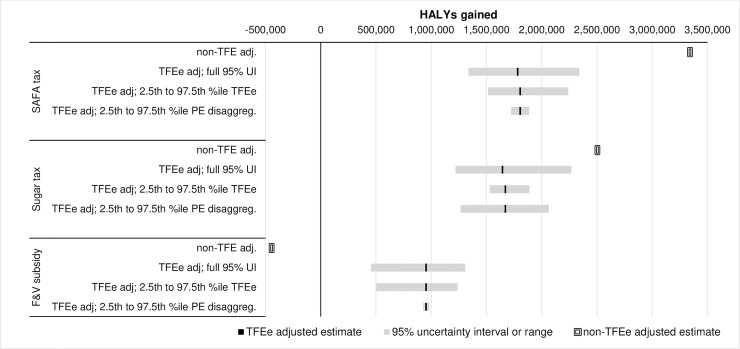
Fig 1. Central estimate of HALY gained and uncertainty ranges, by policy, for: Non-TFEe adjusted; full probabilistic Monte Carlo simulation for total 95% intervals; univariate sensitivity analysis for 2.5th and 97.5th percentile of TFEe distribution; and univariate sensitivity analysis for 2.5th and 97.5th percentile of PE disaggregation scalar.
The central estimates slightly vary between the ‘full’ and two sensitivity analyses, as the former is the mean of all Monte Carlo simulations whereas the latter is the central estimate for one simulation using expected (i.e. average) values for all input parameters. Values used to plot this graph are shown in Table 1 and S5 and S6 Tables.

