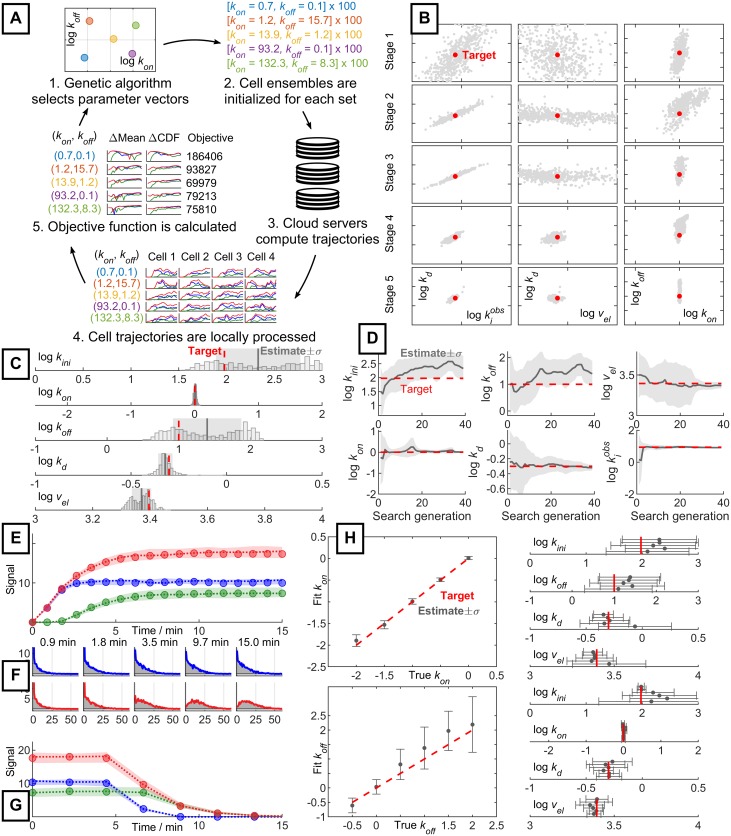
Fig 2. Parameter estimation process and performance.
A: Parallelized calculation of the search objective function for a set of trial parameters (ΔMean: mean squared error, ΔCDF: Wasserstein distance, Objective: error function value). B: Convergence of the genetic algorithm at the end of each stage of the search (red: ground truth target, gray: population of parameter estimates). C: Final trial parameter population from B (red: ground truth target, histogram: estimate population, gray line: mean estimate, gray region: one-sigma region of estimates). D: Evolution of parameter estimates throughout the search process (red: ground truth target, gray line: mean estimate, gray region: one-sigma region of estimates). E: Comparison of mean probe signal between target and fit (circles: target data, dotted line: mean parameter estimate, shaded region around dotted line: signal spanned by fifty estimates sampled from the one-sigma region). Colors as in Fig 1. F: Comparison of copy-number distributions between target and fit (shaded gray regions: target histogram, colored lines: histogram generated from mean parameter estimate, top row/blue: nascent mRNA distribution, bottom row/red: total mRNA distribution). G: Comparison of mean probe signal between target and fit in turn-off cross-validation experiment. Convention as given for E. H: Estimation of modulated parameters. Top trial modulates kon, bottom trial modulates koff. All other parameters are constant but unknown to the search algorithm and are fit independently (red: ground truth target, gray dots and error bars: mean estimate and one-sigma region of three replicates).

