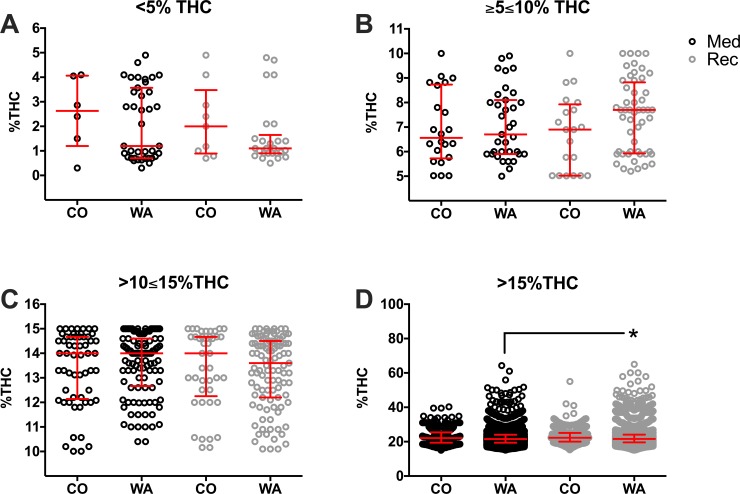
Fig 8. Percent THC at different strength product categories based on THC content in CO and WA medicinal and recreational programs.
Products are presented in the following categories: <5% THC (A), ≥5≤10% THC (B), >10≤15% THC (C), and >15% THC (D) in CO recreational or medicinal menus and WA recreational or medicinal dispensaries. Every herb cannabis product in the surveyed states and programs are plotted as open circles. Medicinal programs (Med; black circles) and recreational programs (Rec; grey circles) were compared. Data are presented as median with interquartile range. *P<0.05 Recreational WA vs. Medicinal WA (linked line). One-way ANOVA and Tukey’s multiple comparison test. Descriptive statistics could be found in S10 Table. The outlier products in the graph might represent herbal products infused with concentrated THC or CBD extracts, however we did not observe such a claim in the studied websites where these products were offered.

