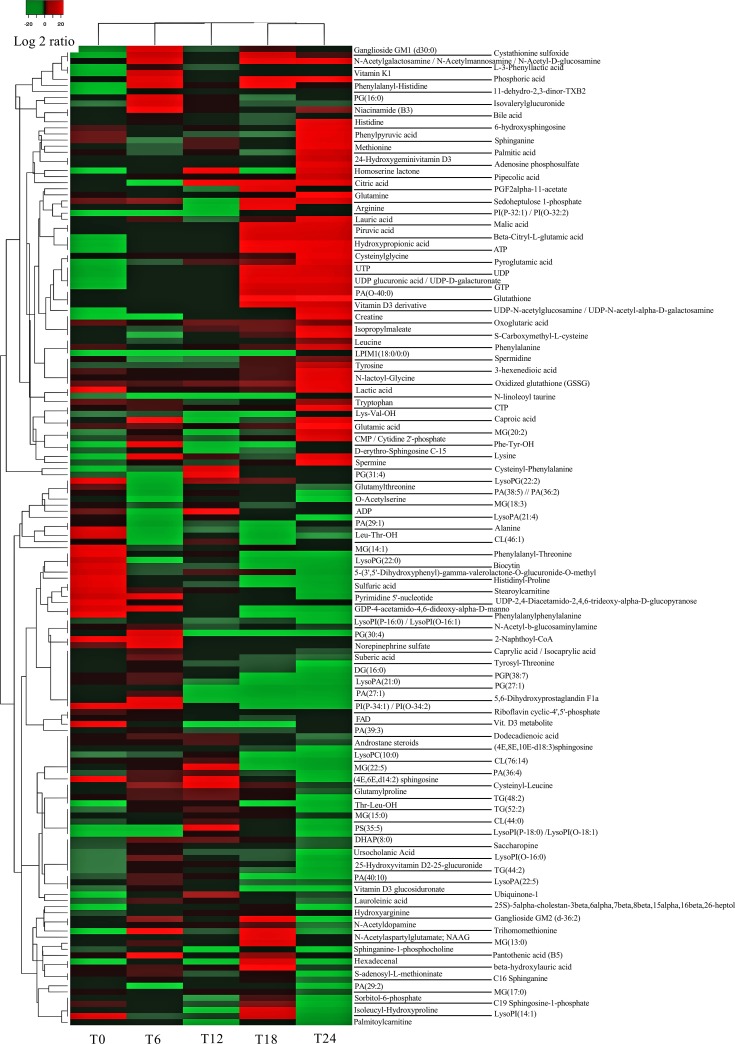
Fig 2. Levels of metabolites in cellular extracts.
Metabolites presenting statistically significant differences between infected and mock-infected cells were selected, and a heatmap was created with the identified metabolites. The heatmap shows the median levels from five independent experiments for each time point (0, 6, 12, 18 and 24 hpi). Individual values from the five independent experiments are represented in S1 Fig. Levels correspond to the compound area and are represented as log2(infected/uninfected).

