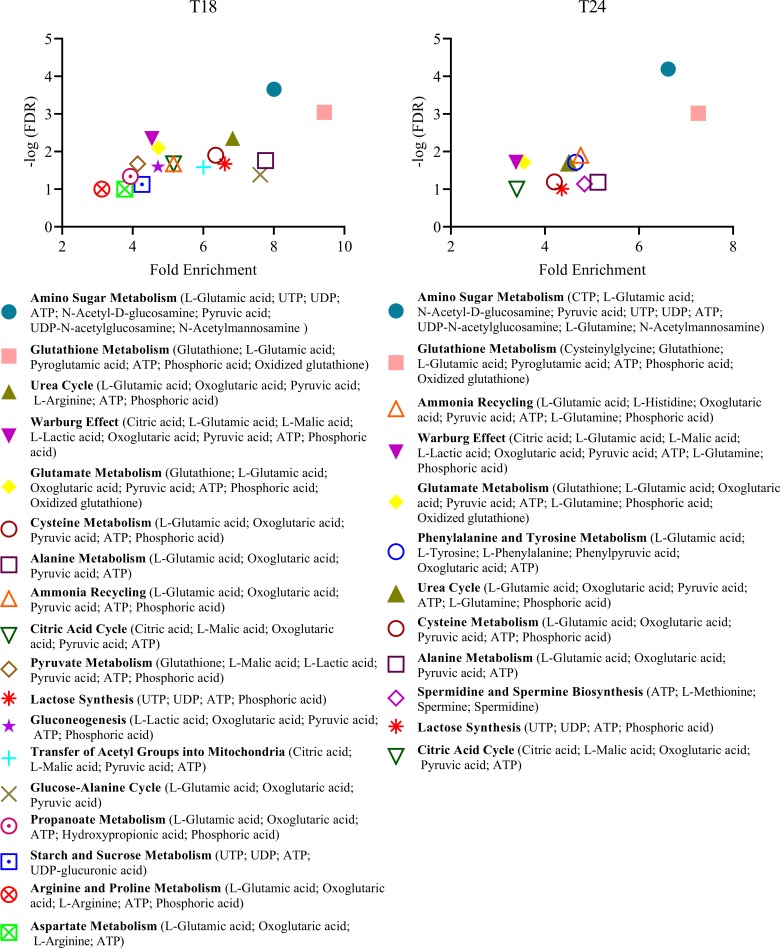
Fig 4. Differentially enriched metabolic sets in HRSV-infected cells compared to the corresponding mock-infected control cells.
The list of metabolites identified as differentially expressed in infected cells versus mock-infected cells was used for enrichment analysis using the MetaboAnalyst online tool and the pathway-associated metabolite sets (SMPDB) library. Metabolite sets with a false discovery rate (FDR) ≤ 0.1 are shown.

